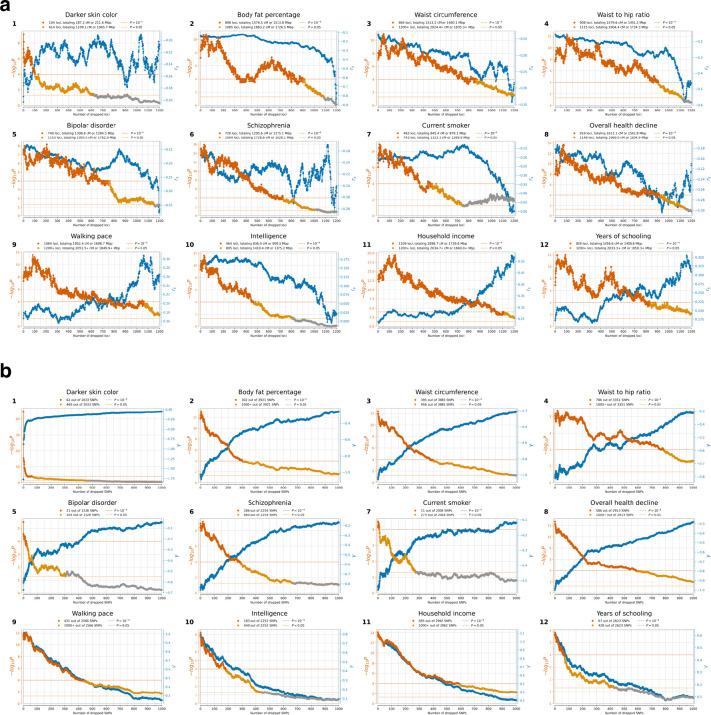
Extended Data Figure 10: Estimating the minimum number of SNPs affected by selection for each trait (gallery of 12 traits also highlighted in Figure 4).
Each panel shows the correlation of a trait with selection summary statistics () as a function of number of dropped loci. The right axis displays in blue; P-value on the left axis in orange. For each SNP, we define a priority score , where is the GWAS effect size, the selection coefficient, and allele frequency. SNPs are sorted by priority score, and in each iteration, a 2cM region around the highest priority SNP is dropped, is recalculated for the remaining genome, and this continues until no SNPs are left. (b) We similarly show estimates at right as a function of number of dropped SNPs (blue), and P-value for polygenic selection at left with dark orange P<0.0001, light orange P<0.05, and gray otherwise.

