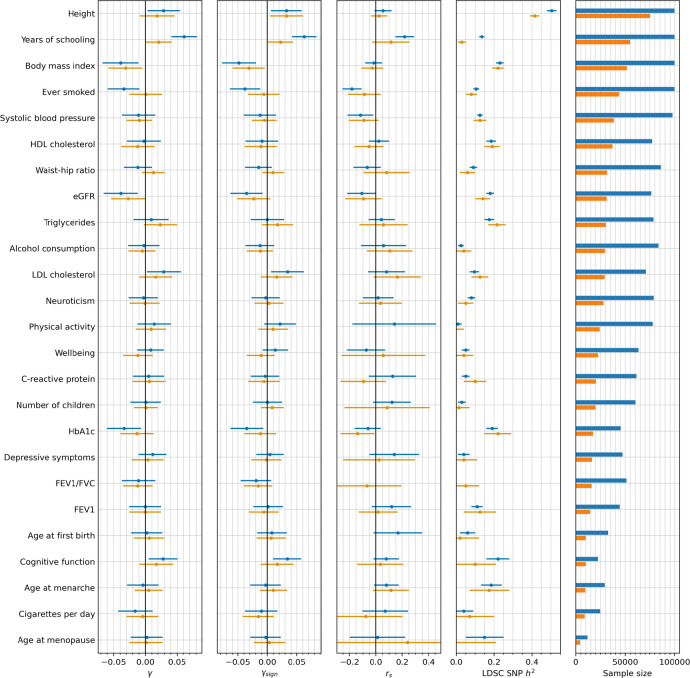
Extended Data Figure 13: Consistency of polygenic selection signals using effect sizes estimated from both GWAS of unrelated people, and sibling-based GWAS66.
The first three columns show estimates for each of the three polygenic tests of selection. The fourth column replicates Figure 5 from66, and shows the estimated SNP heritability h2 by LDSC. The fifth column shows the sample sizes for both GWAS of unrelated people (blue) and sibling-based GWAS (orange). Error bars indicate the 95% confidence interval, which is often larger for the sibling-based GWAS due to limited sample size.

