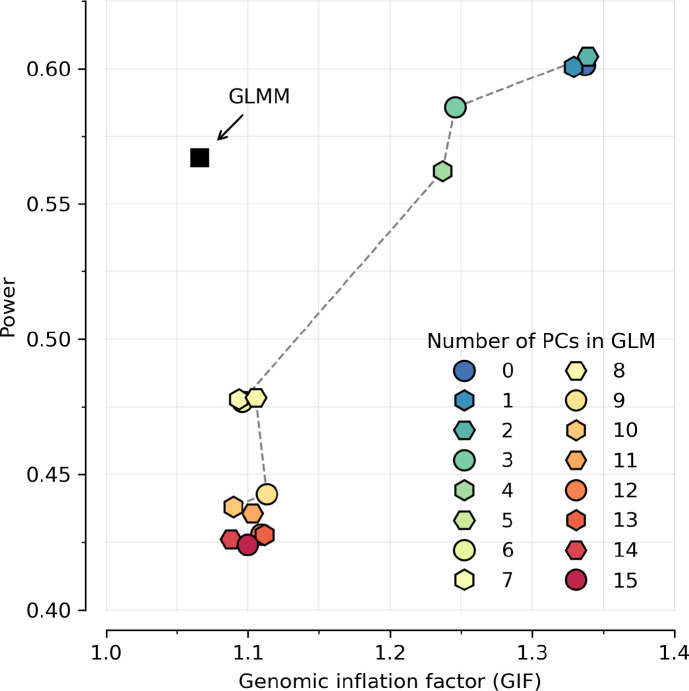
Extended Data Figure 14: Our generalized linear mixed model (GLMM) method is far more powerful than a generalized linear model (GLM) with PC covariates.
To compute the inflation factor for different approaches, we ran 10000 simulations of neutral evolution for a scenario of population structure, sample size, and temporal distribution of samples matching real data. For the power calculation, we ran 20000 simulations of selective sweeps for a range of selection coefficients (power is the proportion of true positives at P<5×10⁻⁸). Because of co-linearity of time and population structure, correcting for PCs greatly weakens power to detect selection, but the GLMM methodology does not suffer from this.

