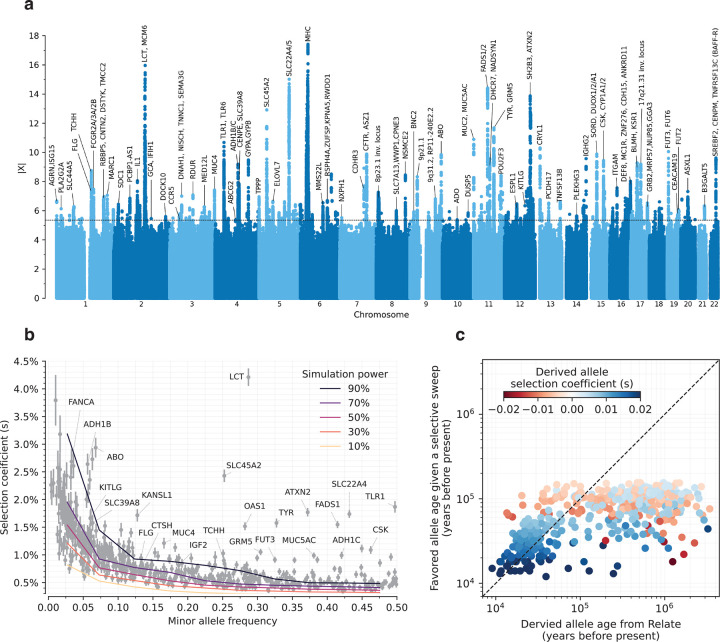
Figure 2: Genome scan for directional selection.
(a) The x-axis is chromosomal position, and the y-axis the selection signal for each variant. The dotted line indicates our genome-wide significance threshold of . For clarity, only select loci are annotated. (b) Selection coefficient () estimated from our scan plotted against minor allele frequency of tagging SNPs at independent loci with FDR<5%. Overlaid grids are simulation-based power estimates (90%, 70%, 50%, 30%, and 10% probability of detection). (c) The estimated age of the favored allele in a selective sweep versus the date of origin of the mutation is inferred from RELATE9, for tagging SNPs with FDR<5% at independent loci. The age of the sweep is defined as the time in the past when the frequency of the favored allele is expected to have been 0.0001 given the present-day frequency in 1000 Genomes Project European populations and assuming the selection coefficient has been constant over time.

