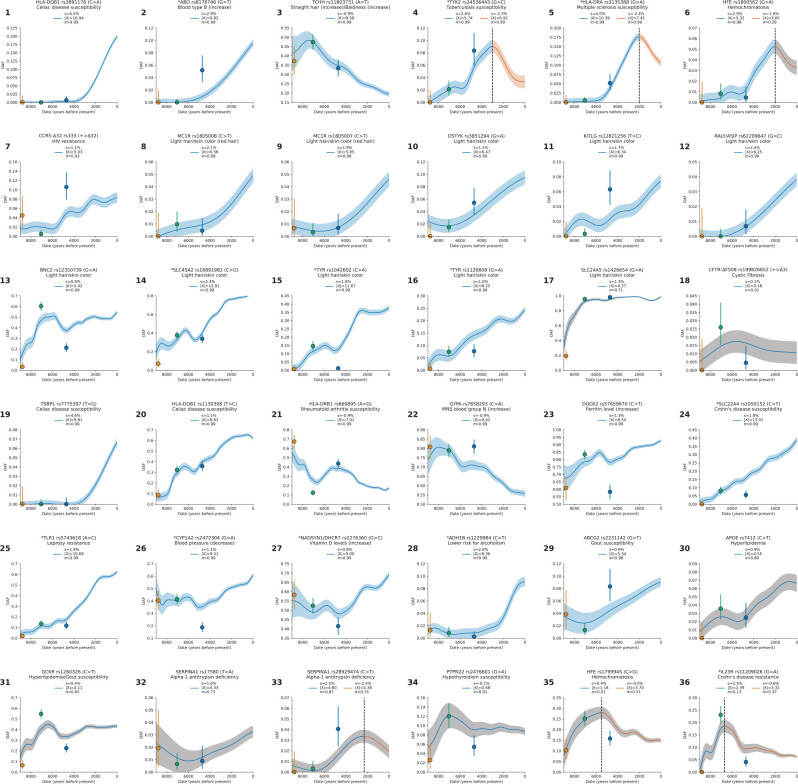
Figure 3: Gallery of notable single-locus selection trajectories.
Each panel displays the derived allele frequency trajectory over time for a variant (uncorrected for structure), along with selection coefficient (), selection statistic (X), and posterior probability of selection (). Circles represent frequencies in Western Hunter-Gatherers (orange), Early European Farmers (green), and Steppe Pastoralists (blue). The highlighted loci are not necessarily those with the strongest signals, and even include negative results. We highlight them here because of their biological interest and because they speak to long-standing debates. For Panels 4, 5, 6, 33, 35, and 36 separate analyses are shown for transects before and after a manually selected peak (marked by a black line), with 200-year overlap. In cases where , the confidence interval is shaded blue (or blue for before and red for after the split); otherwise, the shading is gray. Variants reported in other ancient DNA studies are marked with an asterisk.

