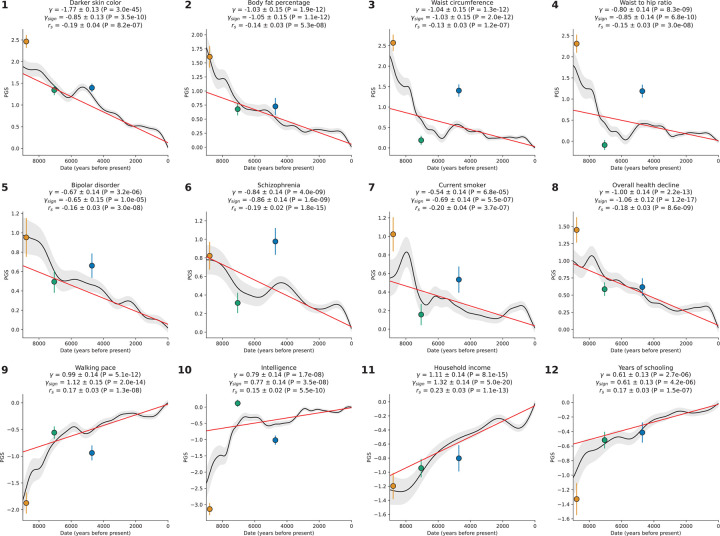
Figure 4: Coordinated selection on alleles affecting same traits (polygenic adaptation).
The polygenic score of Western Eurasians over 14000 years in black, with 95% confidence interval in gray. Red represents the linear mixed model regression, adjusted for population structure, with slope . Three tests of polygenic selection—, , and —are all significant for each of these twelve traits, with the relevant statistics at the top of each panel.

