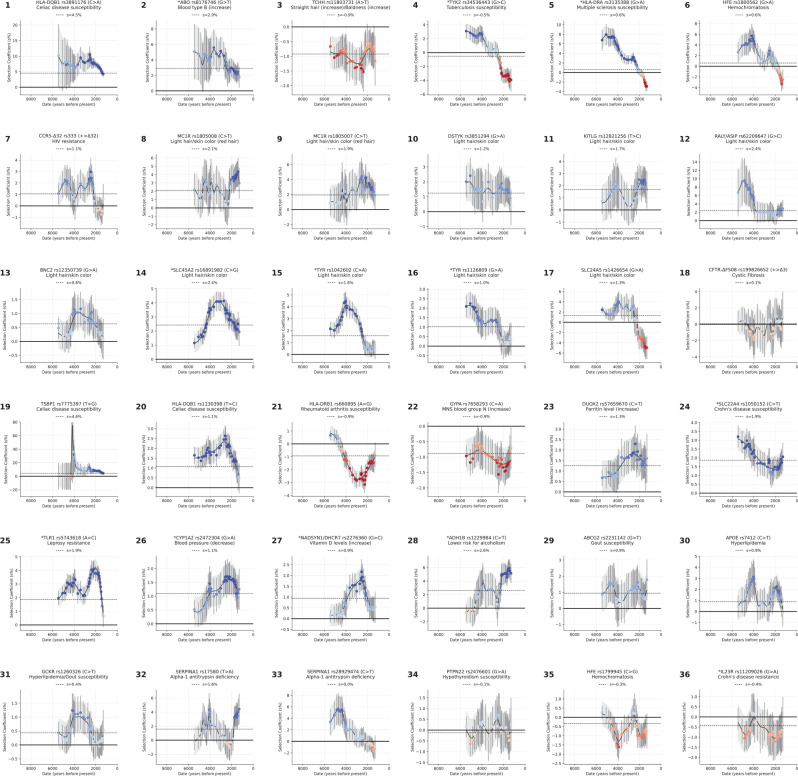
Extended Data Figure 5: How selection coefficients on single variants changed in intensity over time (for the gallery of 36 loci also highlighted in Figure 3).
Time-variant selection coefficients are estimated by refitting our model in sliding windows of 2000 years, with a step size of 100 years, and a minimum of 500 people per window. The present-day is excluded. Color map represents the Z-score for the selection coefficient being non-zero in that window, ranging from −5 (dark red) to 5 (dark blue).

