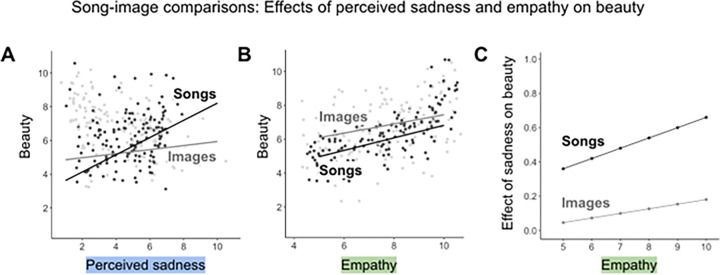
Figure 5.
(A) and (B) Trendlines use slopes and intercepts from SEMs for songs and for images, showing positive simple relationships between perceived sadness and beauty and between empathy and beauty. Datapoints represent mean sadness and beauty ratings for each stimulus for participants at each empathy level. All measures are on a 10-point Likert scale. (C) Lines represent the effect of the interaction between perceived sadness and empathy on beauty for songs (p< 0.001) and images (p > 0.05).

