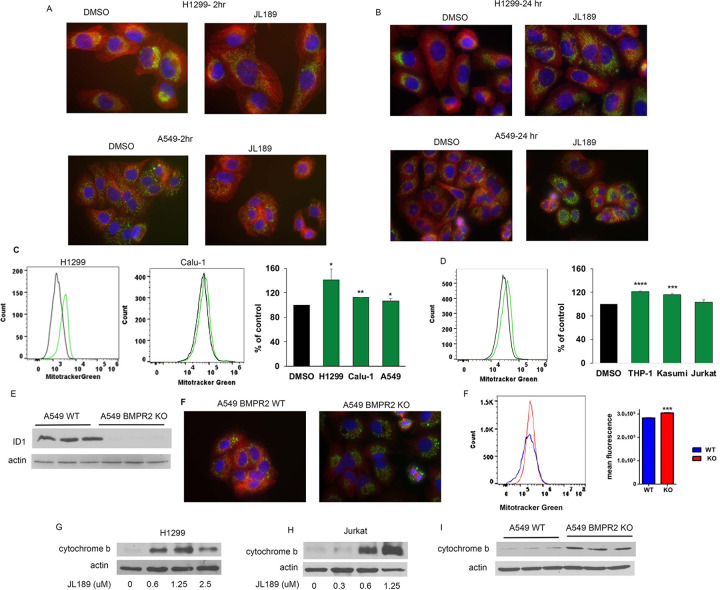
Figure 2. BMPR2i increases mitochondrial mass.
(A-B) Co-immunofluorescent imaging of a-tubulin (red) and TFAM1 (green) with nucleus stained with DAPI (blue) of H1299 and A549 cells treated with JL189 2.5 mM for 2 and 24 hr. Cell treated with JL189 exhibited trafficking of the mitochondria with greater TFAM1 fluorescence after 24 hr. (C)MitoTracker Green fluorescence was analyzed by flow cytometry after 24 hr of treatment with JL189 2.5 mM or DMSO control. The graph represents the mean of 4 studies presented as the percentage of control. (D) Coimmunofluorescent imaging of a-tubulin (red) and TFAM1 (green) in A549 WT and KO cells. (E) MitoTracker Green analysis demonstrate that A549 BMPR2 KO cells have significantly greater fluorescence compared to A549 WT cells. The graph shows mean fluorescence of 4 studies. (F)Western blot analysis of total protein lysate from A549 WT and A549 BMPR2 KO cells demonstrating an increase in cytochrome b.

