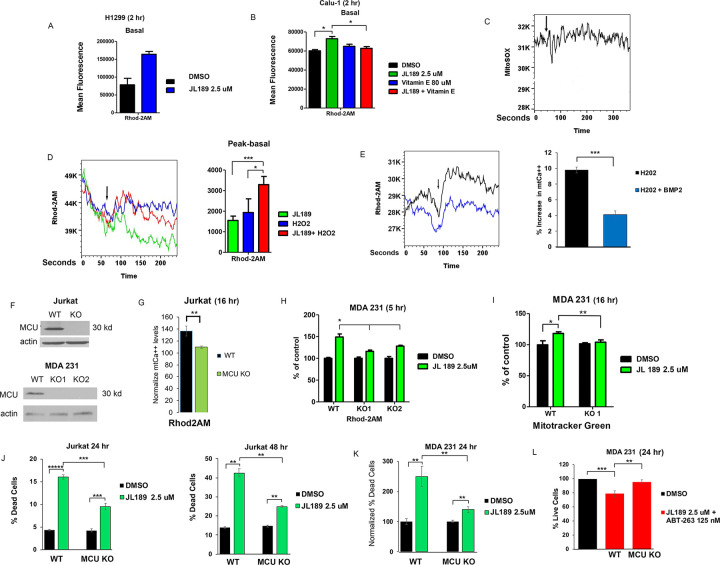
Figure 8. BMPR2 signaling regulates redox sensing of the MCU.
(A-B) BMPR2i with JL189 increases basal mtCa++ levels that is inhibited with vitamin E. The graphs show the mean Rhod2AM fluorescence of 4 studies cells treated for 2 hr. (C) Representative study of Calu-1 cells loaded with MitSox Red then treated with JL189 2.5 mM and analyzed by flow cytometry for 3 minutes. (D) Calu-1 cells loaded with Rhod-2AM in Ca++ free media, were treated with JL189 2.5 mM, hydrogen peroxide (H2O2), or the combination of JL189 and H2O2 and then analyzed by flow cytometry for 3 minutes. Arrows mark the time of treatment. The graph represents the mean of the peak minus the basal values of 4 experiments. (E) Calu1 cells loaded with Rhod-2AM were treated with H2O2 500 mM or H202 500 mM pretreated with BMP2 ligand 20 ng/ml for 45 minutes and then analyzed by flow cytometry for 3 minutes. The graph represents the mean percent increase from the basal to peak values of 3 experiments. Studies suggest that BMPR2 signaling inhibits ROS- induced uptake of calcium into the mitochondria. (F) Western blot analysis of Jurkat and MDA 231 WT and MCU KO cells. (G-H) Jurkat and MD1 231 WT and MCU KO cells were treated with JL189 2.5 mM or vehicle for 16 or 5 hr. (G) The data represents the mean fluorescence intensity of Rhod2AM+/DAPI- cells of 4 studies normalized to control. (H) Data represent the mean Rhod2AM fluorescence intensity of 2 studies presented as percent change from control. (I) MDA 231 WT and MCU KO cells were treated with JL189 for 16 hr then loaded with MitoTracker Green and analyzed by flow cytometry. The graph shows with mean fluorescence of 6 studies presented as the percent change from control. (J-K) Cell counts of (J) Jurkat and (K) MDA-231 WT and MCU KO cells treated with (J) JL189 for 24 and 48 hr. The graph represents the mean percentage of dead cells of at least 4 studies. (K) Cells were treated for 16–24 hr and % increase in dead cell normalized to control. Data represents the mean of 5 studies. (L) Cell counts of MDA 231 WT and MCU KO cells treated with JL189 combined with ABT-263 for 24 hr. The data are presented as the mean percentage of live cells in 4 studies normalized to the control.

