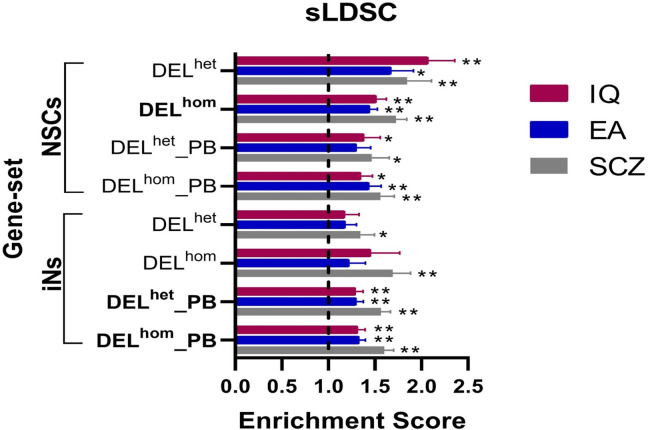
Fig 2. Results from sLDSC analysis of MEF2C direct target gene-sets using GWAS data.
The graph plots the enrichment values, defined as the ratio of heritability (h2) to the number SNPs, on the x-axis. The error bars represent the standard errors. Two asterisks (**) indicate significance after Bonferroni correction, and one asterisk (*) indicates nominal significance. Gene-sets enriched for the three phenotypes are highlighted in bold. NSCs: Neural stem cells; iNs: induced neurons; DELhom: Homozygous deletion; DELhet: Heterozygous deletion; PB: Proximal Boundary.

