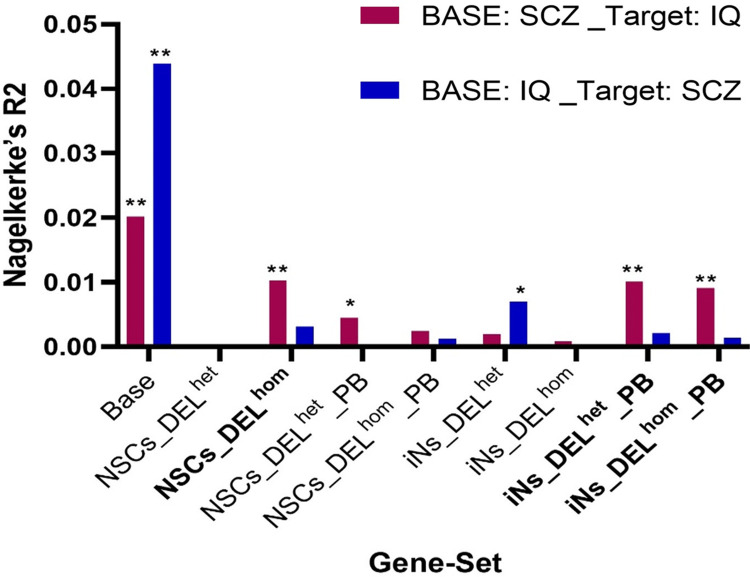
Fig 3. Gene-set based PRS analysis to examine associations between the SCZ-PRS and IQ, and between the IQ-PRS and SCZ.
Base on the x-axis refers to a PRS generated using all variants in the genome. The height of the columns on the y-axis indicates the proportion of variance in the phenotype explained when a gene-set based PRS is constructed using SCZ GWAS data and is tested against IQ (pink columns) or when a gene-set based PRS is constructed using IQ GWAS data and is tested against SCZ case-control status (blue columns). Two asterisks (**) indicate significance after Bonferroni correction, and one asterisk (*) indicates nominal significance. NSCs: Neural stem cells; iNs: induced neurons; DELhom: Homozygous deletion; DELhet: Heterozygous deletion; PB: Proximal Boundary.

