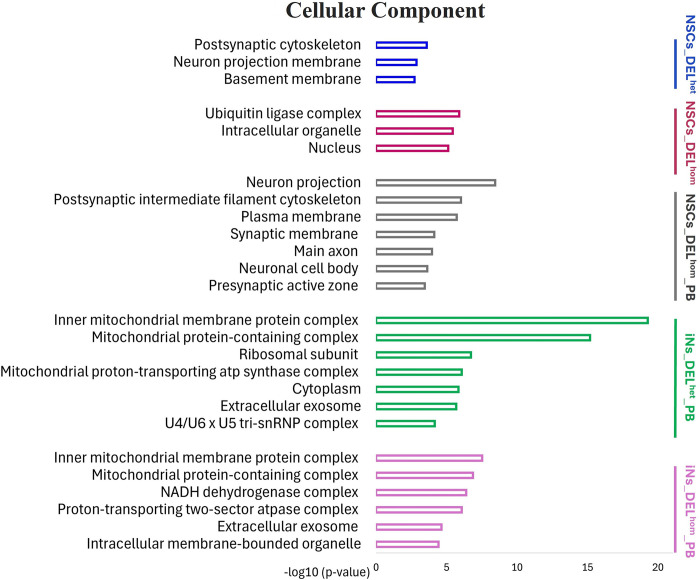
Fig 6. Bar charts of gene ontology (GO) analysis of cellular component for MEF2C direct target gene-sets using the ClueGo plugins of Cytoscape.
The Bonferroni method was applied for a p-value correlation (p < 0.05). The vertical axis displays the names of the GO terms. The horizontal axis and bar lengths represent the significance [−log10 (p-value)]. Colors in the bars represent different MEF2C direct target gene-sets. Results are presented only for the five gene-sets that were previously enriched for common variation associated with SCZ, IQ and/or EA. Enriched terms that were related to each other in the ontology were grouped together, with the most significant term(s)/group displayed. All data is detailed in S16–S23 Tables. NSCs: Neural stem cells; iNs: induced neurons; DELhom: Homozygous deletion; DELhet: Heterozygous deletion; PB: Proximal Boundary.

