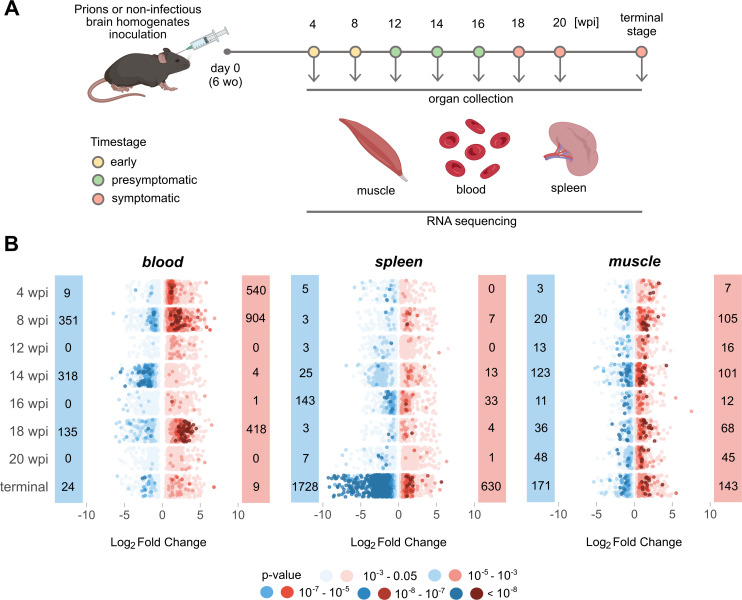
Fig 1. Temporal Dynamics of Gene Expression in Prion-Affected Tissues.
(A) Muscle, blood, and spleen tissues were collected for bulk RNA sequencing at eight individual timepoints (wo = weeks old; wpi = week post inoculation). Samples were stratified into early, presymptomatic, and symptomatic stages. Panel created with BioRender.com (B) Prevalence of upregulated (red) and downregulated (blue) DEGs (p-value < 0.05) across disease progression in the three tissues analysed. The dots in the dot plot represent individual genes and are color-coded according to their corresponding p-values.

