
Figure 5.
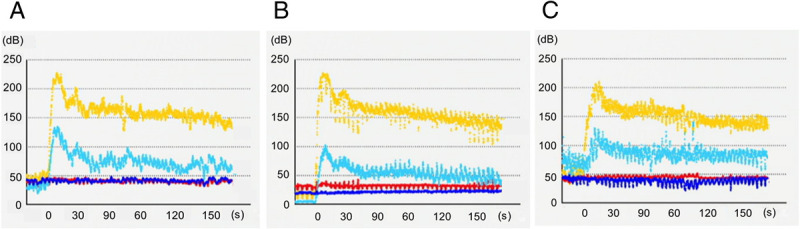
Time-intensity curve analysis results. Characteristic visual findings showing hyperenhancement and slow washout in 3 tumors were objectively obtained. Yellow line shows contrast intensity of pancreatic tumor. Light blue line shows contrast intensity of surrounding pancreatic parenchyma. Red line shows base echo intensity of pancreatic tumor before injection of the contrast agent. Blue line shows base echo intensity of surrounding pancreatic parenchyma before injection of the contrast agent. (A) Tumor in head. (B) Tumor in body. (C) Tumor in tail.