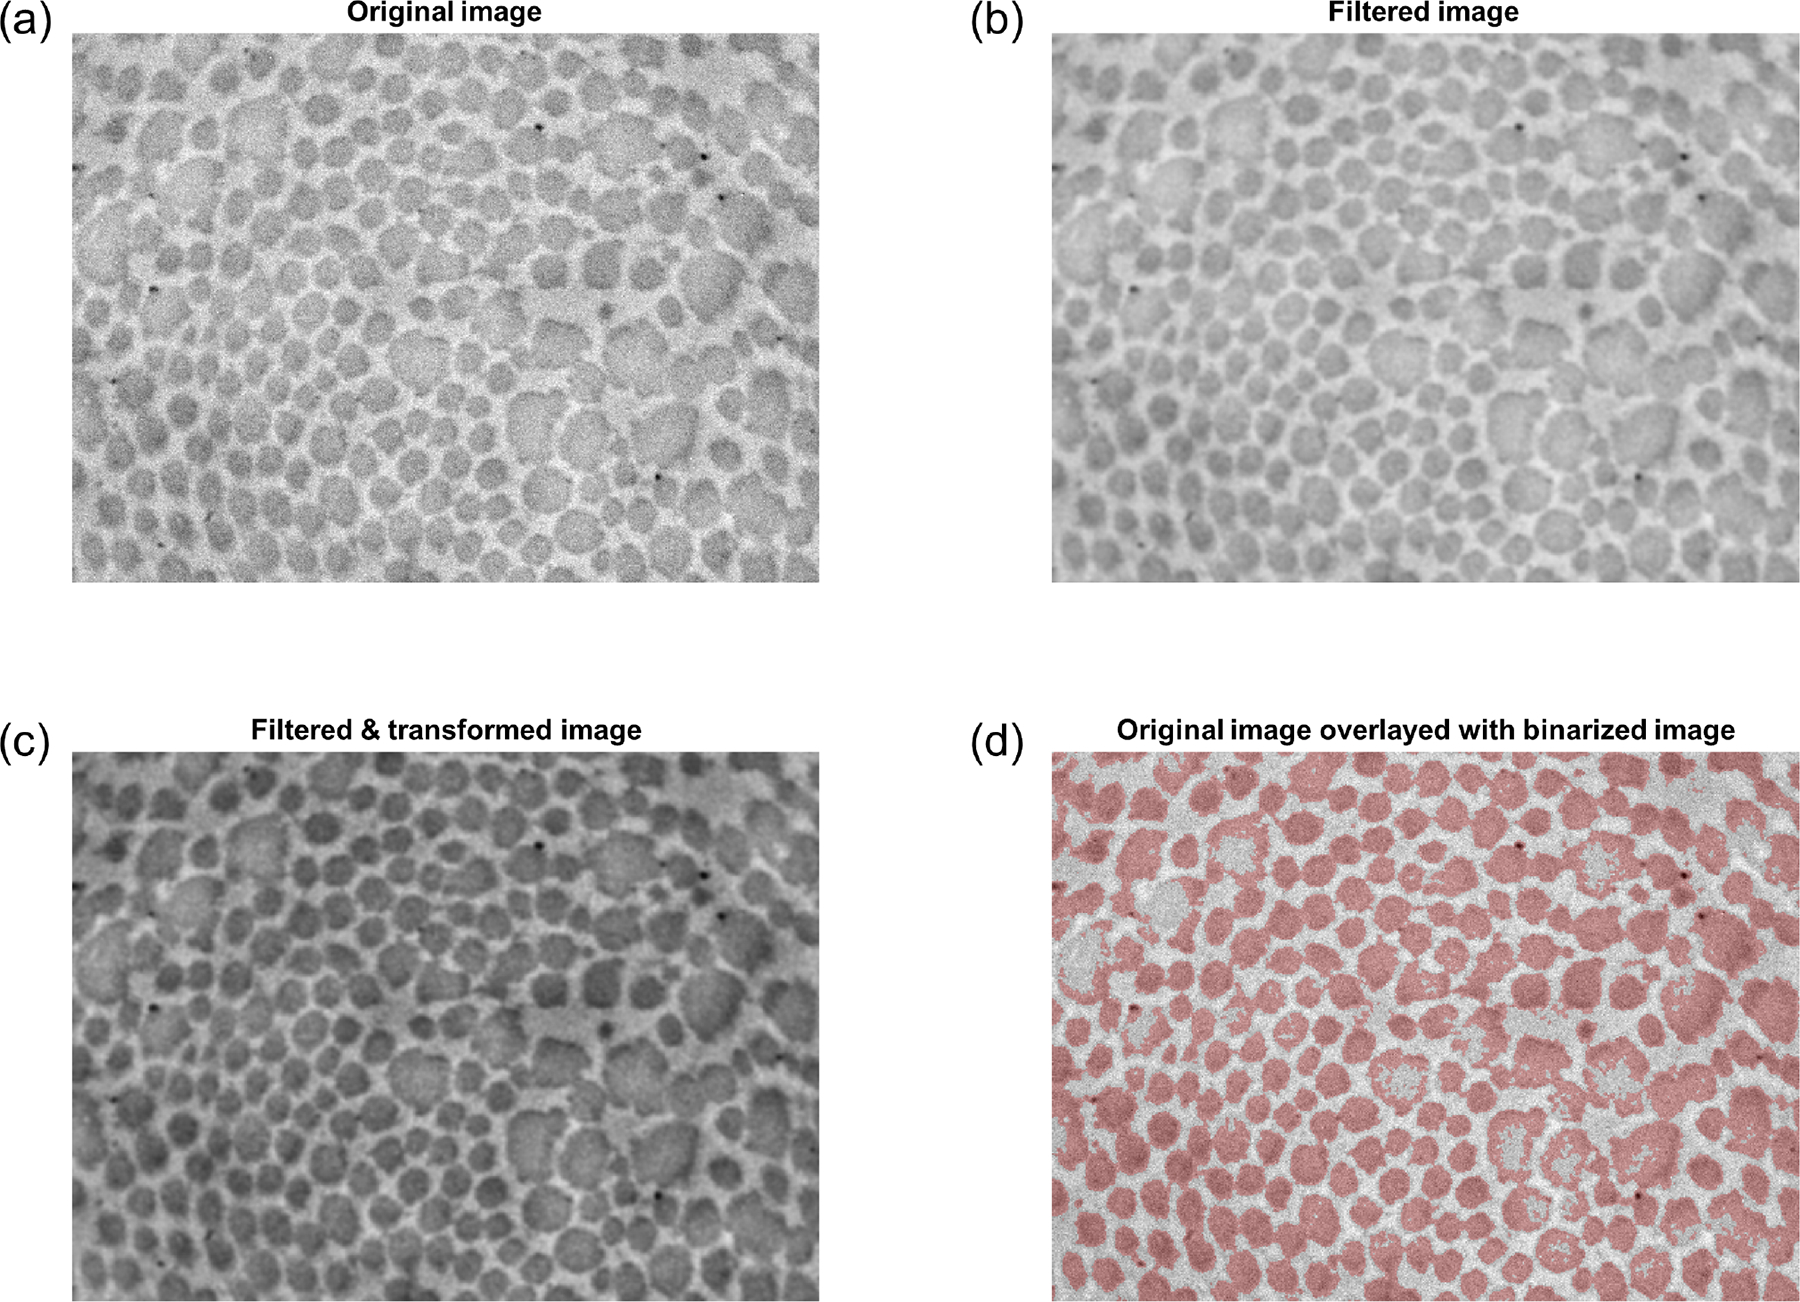
Fig. 2.

Filtering and binarization pipeline. (a) Original TEM image (Tgfbr1r2 DTA). Note the moderate but perceptible variations in intensity across the image, with regions near the corners generally appearing darker than the middle. (b) Image after Gaussian filtering. (c) Image after subsequent power transformation via Equation 5, which attenuates regional variations in intensity. (d) Overlay of the original image (grayscale) with the binarized image (red). Note that in images of pathological vessels (such as the one shown), this first binarization attempt performs poorly in larger fibrils that have uneven intensity.
