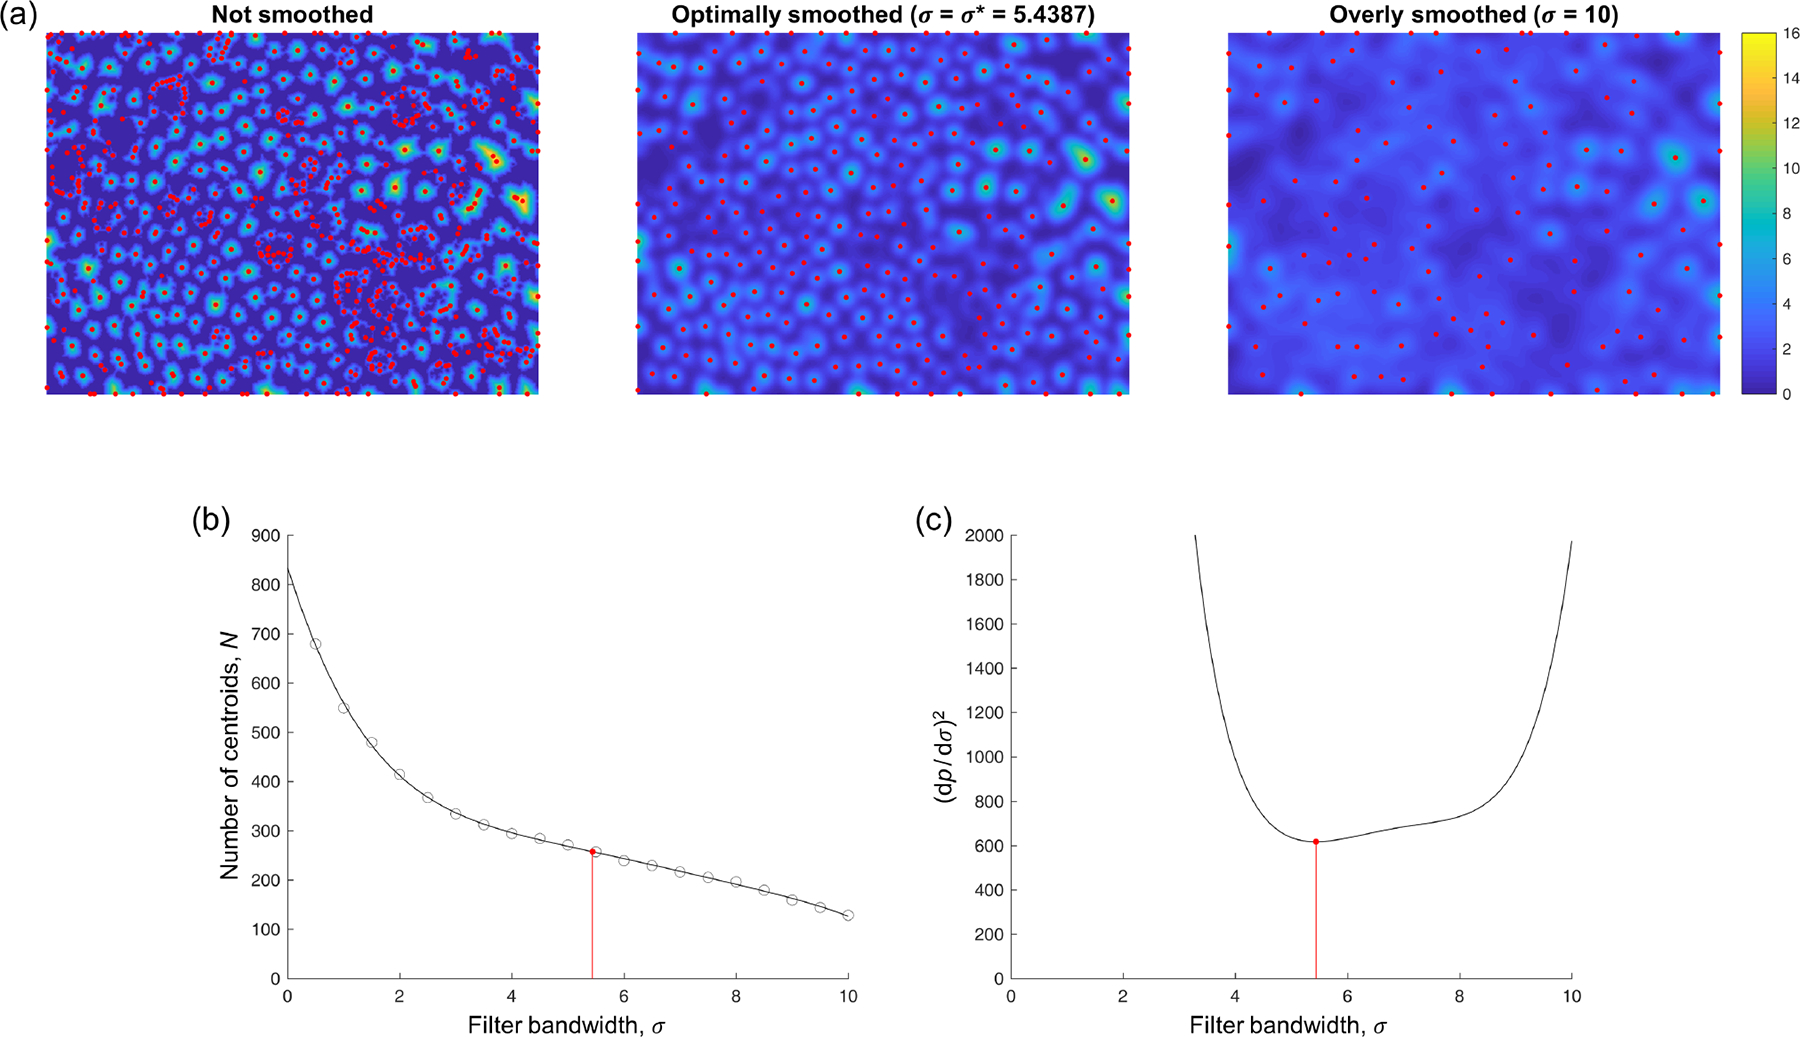
Fig. 3.

Fibril centroid detection. In (a), the color scale displays the distance field (unsmoothed) or (smoothed with the indicated bandwidths ). Local peaks in the field, plotted in red, are treated as candidate locations for the centroids of all the collagen fibrils in the image. (b) The number of centroids detected with different filter bandwidths . Circles denote actual results, while the plotted curve corresponds to the 5th-degree polynomial fit . The optimal filter bandwidth (red) corresponds to the point at which is least sensitive (locally) to . (c) Equivalently, the optimal filter bandwidth corresponds to the lowest positive where reaches a local minimum, which is straightforward to compute.
