
Fig. 4.
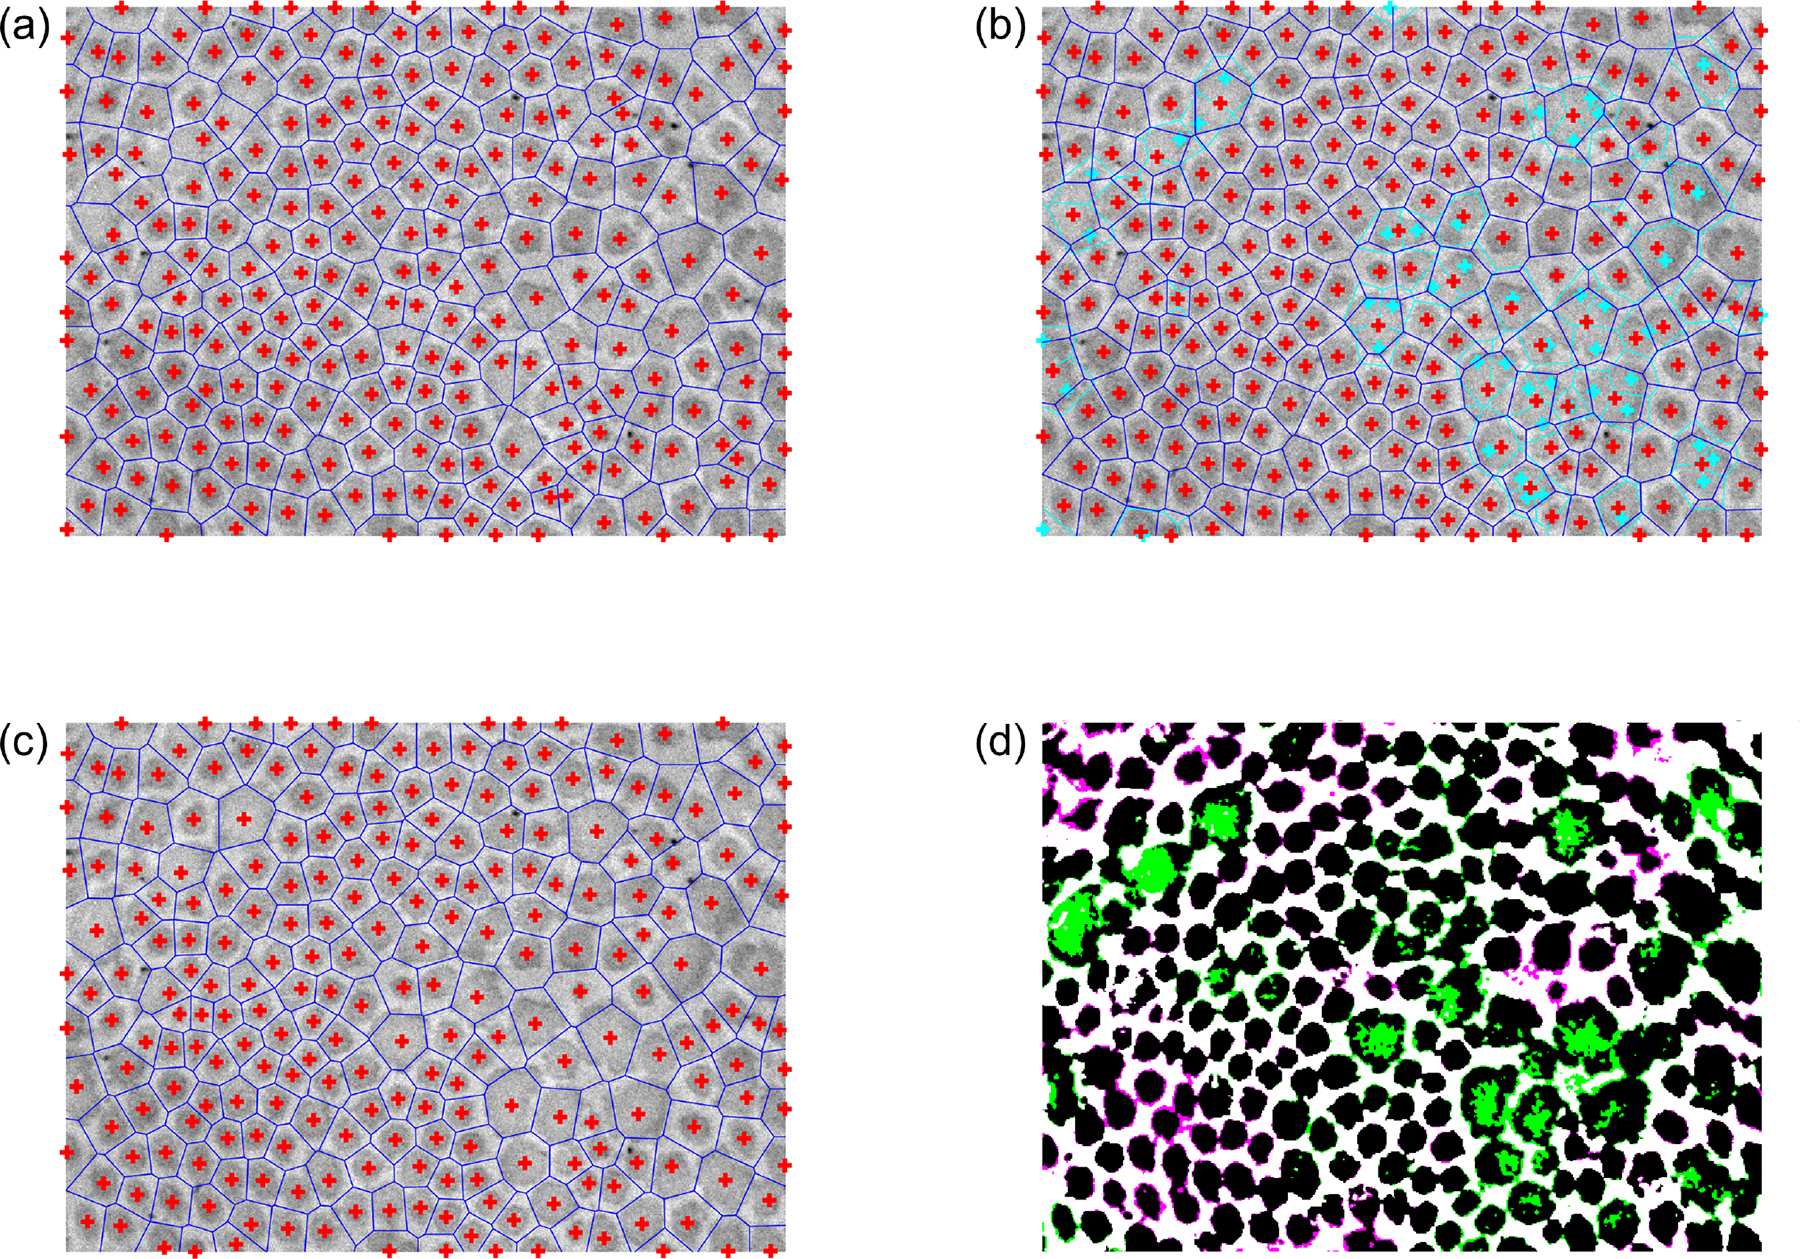
Fibril neighborhoods based on Voronoi tesselation. (a) Initial guess for the fibril neighborhood boundaries (blue) using centroids (red crosses) based on the local peaks in the optimally smoothed . (b) Subsequent interactive correction of the centroid locations. New centroids and boundaries are shown in red and blue, respectively, while the initial guess centroids and boundaries are now shown in cyan for comparison. (c) The final user-approved centroid locations and corresponding Voronoi tesselation. (d) Improved binarization based on the corrected centroid locations and neighborhood boundaries, using a smooth heterogeneous transformation of the intensity field based on characteristic neighborhood intensities that account for intrafibrillar intensity variations. Regions whose categorization changed from non-fibrillar to fibrillar are colored green, while regions whose categorization changed from fibrillar to non-fibrillar are colored magenta. The categorizations of black and white regions are unchanged (fibrillar and non-fibrillar, respectively).