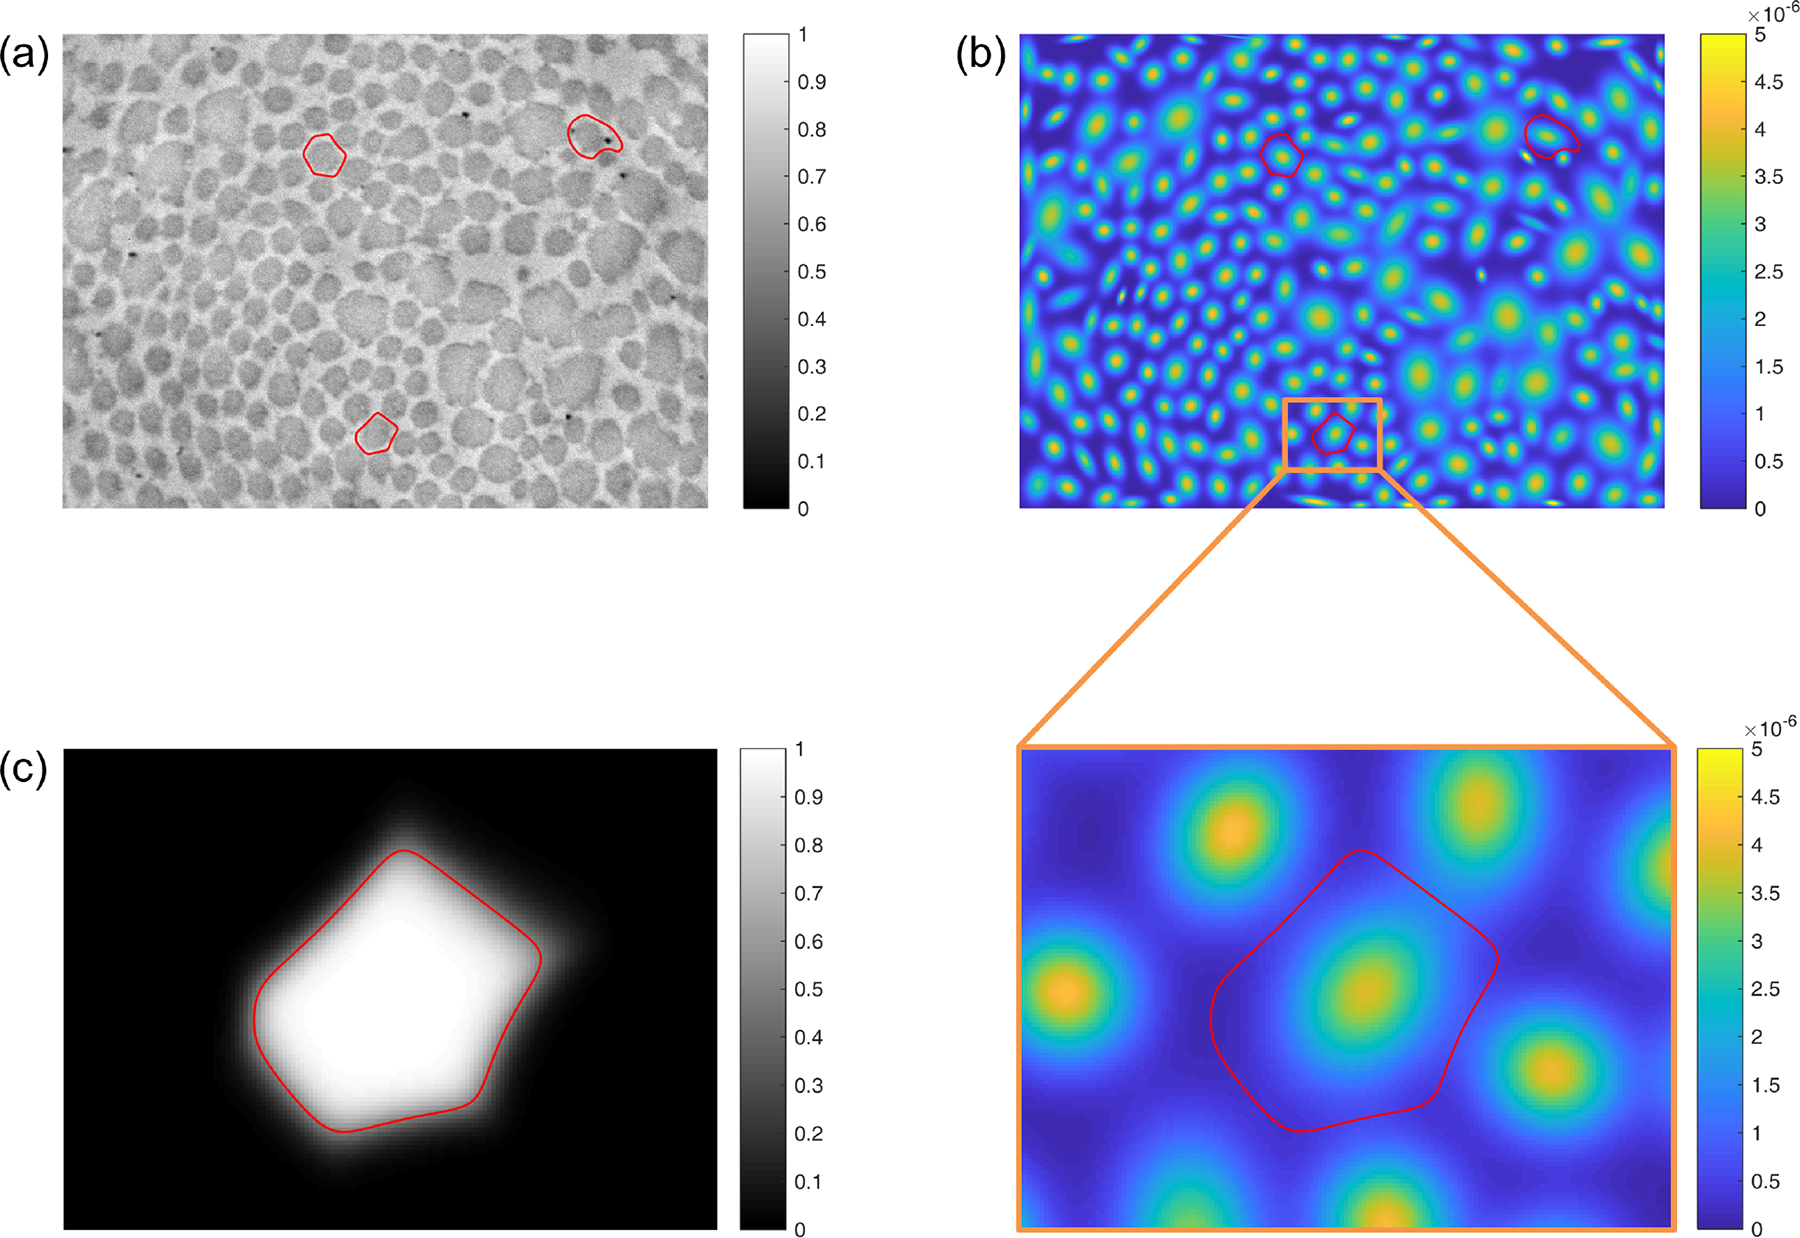
Fig. 5.

(a) A TEM image, showing improved fibril neighborhood boundaries (red) for three representative fibrils. These boundaries are computed based on fitting an -component Gaussian mixture model to all fibrillar pixel locations. (b) The same three neighborhood boundaries, plotted together with the probability density function of the resultant Gaussian mixture model. A region of interest surrounding one of the representative fibrils is enlarged for clarity. (c) The posterior membership probability field for the Gaussian component (i.e., fibrillar pixel population) centered in the region of interest. The final neighborhood boundary, defined implicitly as the contour at which , represents that largest -based region that is guaranteed not to overlap with any adjacent fibril neighborhoods, which are defined in the same way.
