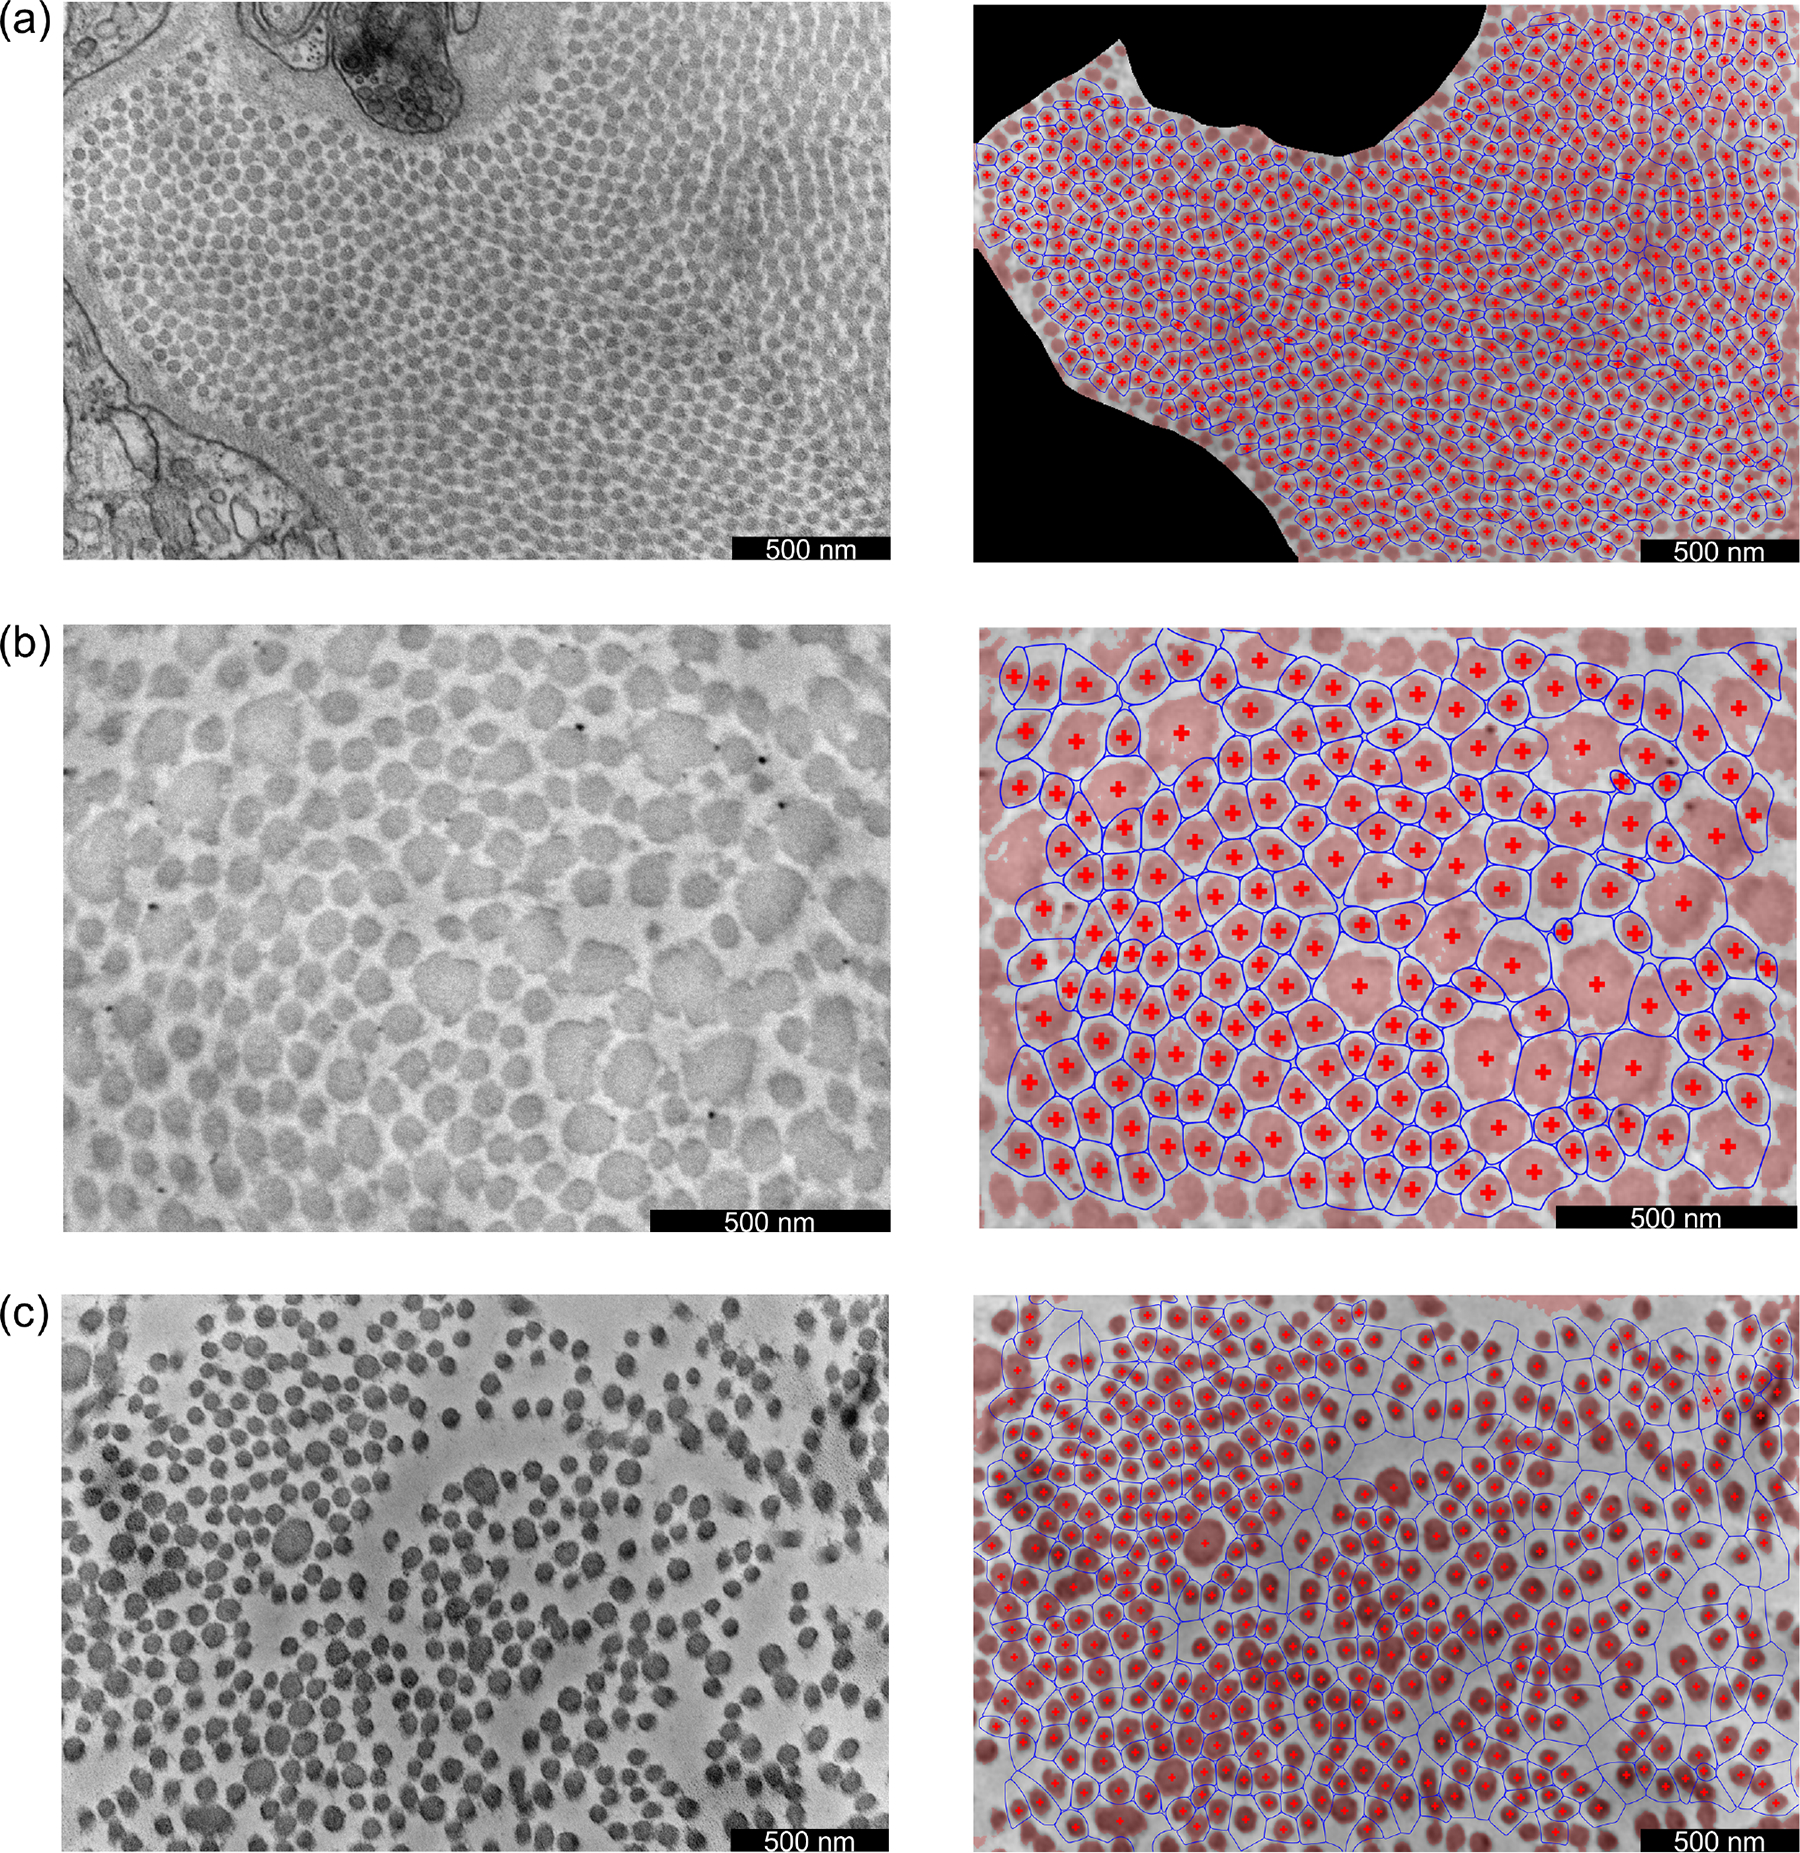
Fig. 7.

Illustrative results for (a) a WT control ATA, (b) a DTA with postnatal disruption of Tgfbr1r2, and (c) a Fbn1C1041G/+ ATA. Acquired TEM images are shown in the left column, while corresponding results are shown in the right column. In the results, pixels categorized as fibrillar have a light red overlay, the fibril centroids are denoted by red crosses, and the fibril neighborhoods are denoted by blue curves.
