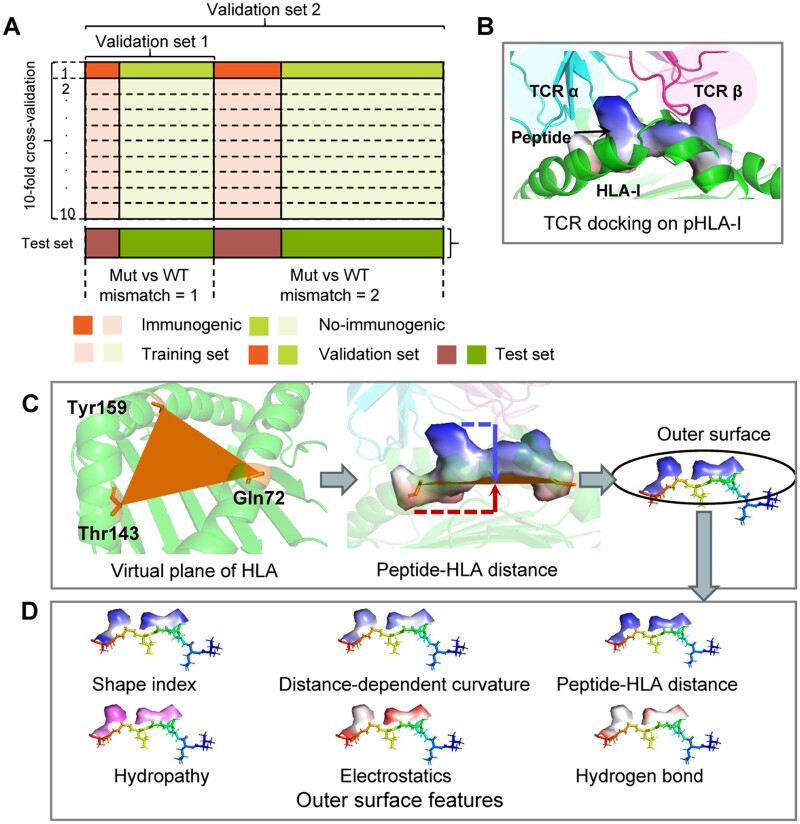
Figure 2.
Description of the dataset for PepFore and the process of peptide surface. (A) PepFore is evaluated using standard 10-fold cross-validation with 90% of the data points (29 665). The validation set 1 is a precise data set in which WT/Mut pairs only contain one mismatch. The validation set 2 is a rough data set in which WT/Mut pairs contain one or two mismatches. Ten percent of the data points (3297) were used as the test set. (B) Schematic representation of TCR docking on pHLA-I (PDB: 1bd2). The TCR α chain and TCR β chain sit on top of the pHLA-I complex. (C) A virtual plane is determined by the three Cα atom coordinates of HLA-I (Gln72, Thr143, and Tyr159). The peptide-HLA distance is measured from the mesh on the peptide surface to the plane of the HLA-I. (D) Six outer surface features were selected as the input for the PepFore model.

