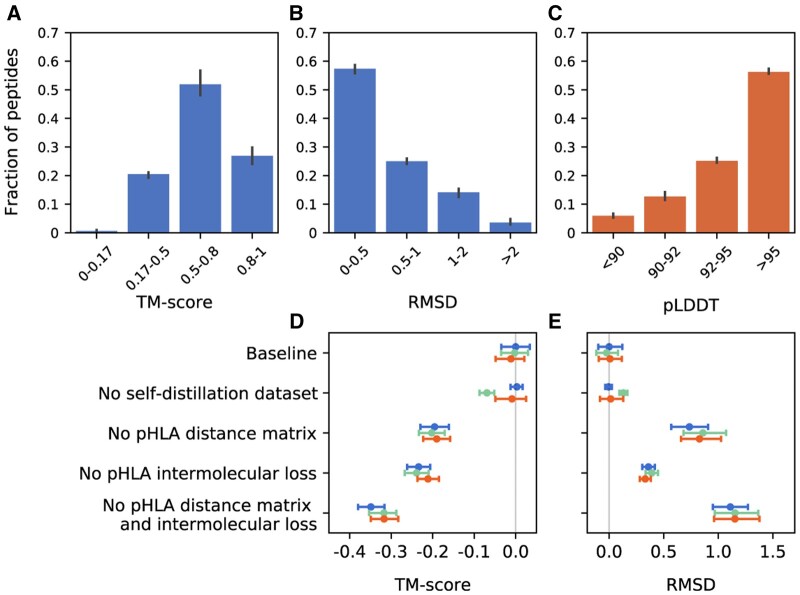
Figure 3.
Accuracy and ablation results of PepConf. Error bars show a 95% confidence interval. (A, B) Histograms of TM-score and RMSD for PDB test data (n = 104). (C) Histogram of pLDDT for IEDB test data (n = 3000). (D, E) Ablation results of PepConf. TM-score and RMSD are selected as structure accuracy metrics. Each ablation group is replicated three times, with different colors indicating each repetition. The ablations are reported as a difference compared with the average of the three baseline seeds. Baseline: full model with self-distillation dataset training. No self-distillation dataset: full model without self-distillation dataset training. No pHLA distance matrix: we set the part of the representation matrix that describes the spatial distance between the peptide and HLA-I molecule to zero. No pHLA intermolecular loss: we remove the pHLA intermolecular loss.

