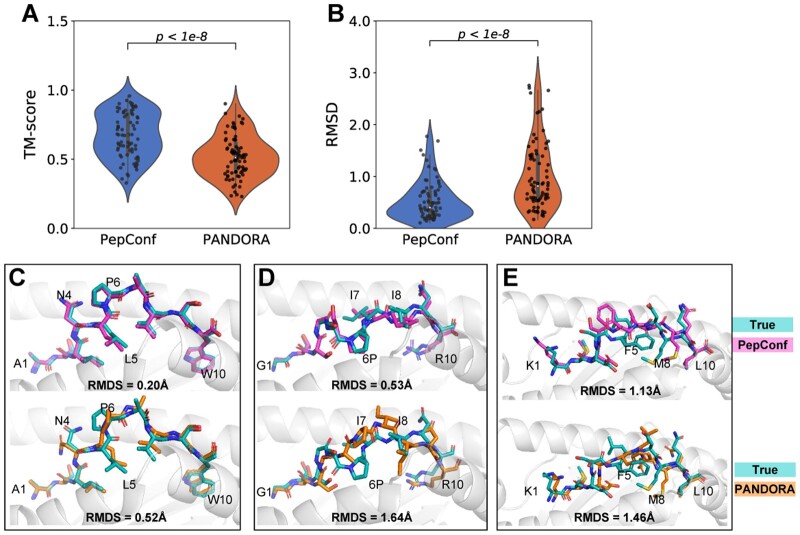
Figure 4.
Modeling results of PepConf and PANDORA. (A, B) Comparison of peptide TM-score and RMSD between PepConf and PANDORA on the PDB test set (n = 104). For each data point, PANDORA generated 20 pHLA complex structures, and the modeling structure with the best molpdf score is selected as the final result. The P-value is computed using the Wilcoxon signed-rank test. (C, E) Comparison of the modeled structure between PepConf and PANDORA. For (C), the peptide sequence is ASLNLPAVSW, and the HLA allele is B*57:03 (PDB: 6v2p). For (D), the peptide sequence is GTSGSPIINR, and the HLA allele is A*11:01 (PDB: 5wkh). For (E), the peptide sequence is KMDSFLDMQL, and the HLA allele is A*02:01 (PDB: 3bhb).

