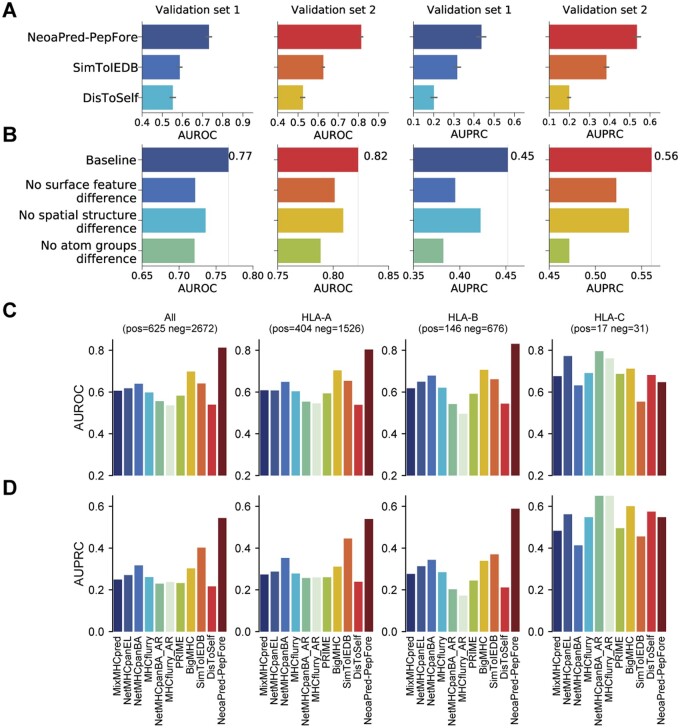
Figure 6.
Performance comparison and ablation results of PepFore. (A) Measurement of PepFore performance by AUROC and AUPRC values of the 10-fold cross-validation in validation sets 1 and 2. The results of two other foreignness scores, SimToIEDB and DisToSelf, are also shown. (B) Sub-block ablation results for validation sets 1 and 2. Baseline: full model. No surface feature difference: we set the dissimilarity of WT/Mut surface features to zero. No spatial structure difference: we remove the WT/Mut spatial distance matrix. No atom group difference: we remove the WT/Mut atom group comparison block. (C, D) Performance comparison between PepFore and 10 common neoantigen prediction methods. We compared the performance of PepFore with 10 other methods using two metrics, AUROC and AUPRC, in the PepFore test set. The complete test set consisted of 625 positive samples and 2672 negative samples. Additionally, we evaluated the predictive performance separately for the HLA-A, HLA-B, and HLA-C alleles. The number of samples for each allele is indicated in the figure.

