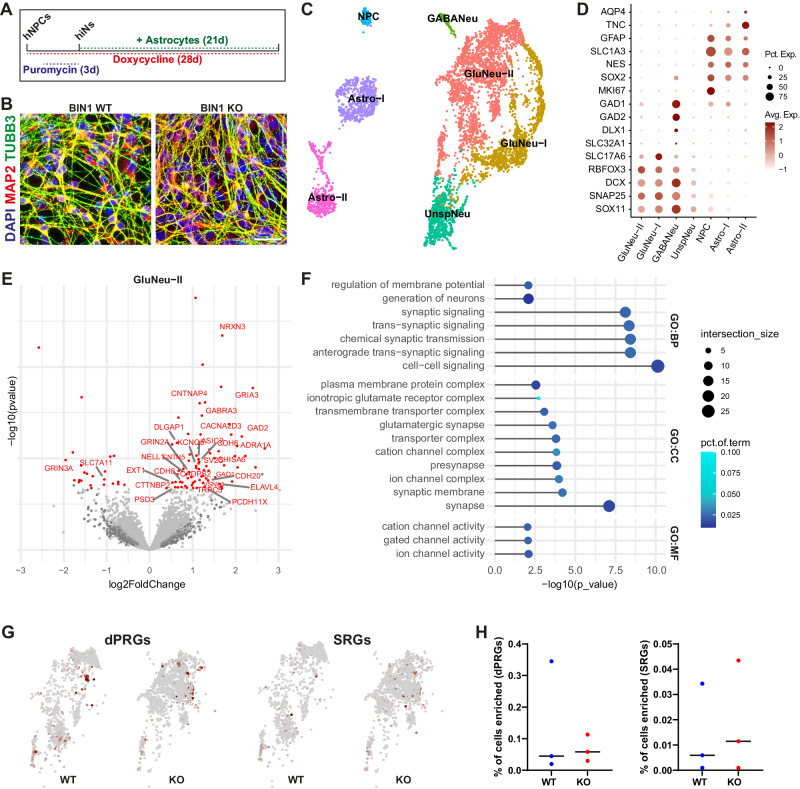
Fig. 3. Neuronal-specific BIN1 KO cell-autonomously elicit transcriptional changes.
A Scheme of the Ascl1-induced hiNs experiments. B Images showing BIN1 WT and KO hiNs 7 days after the beginning of doxycycline treatment immunolabeled for neuronal markers MAP2 and TUBB3 and astrocyte marker GFAP and stained with DAPI. Scale bar: 50 μm. C UMAP representation of the different cell subtypes identified in ASCL1-hiNs cultures using snRNA-seq (n = 3 independent culture batches). D Dot plot representing expression of key markers used to annotate cell subtypes. E Volcano plot representing DEGs comparing BIN1 KO vs WT glutamatergic neurons (GluNeu-II). Differential expression analysis was performed using DEseq2 on the sample level gene expression matrix, including the experiment batch as covariates. DEGs with adjusted p value < 0.05 and |log2FC | >0.25 are shown in red. Gene labels are shown for calcium- and synapse-related genes. F Functional enrichment analysis of DEGs identified in glutamatergic neurons. Bar plots representing the top 15 the enriched GO terms in each category at adjusted p value < 0.01. G UMAP representing GluNeu-II enrichment for dPRGs and SRGs (Tyssowski et al., 2018). Red points indicate enrichment with adjusted p value < 0.05, hypergeometric test using CellID. H Dot plots showing percentage of GluNeu-II cells enriched for dPRGs and SRGsby genotype in 3 independent cultures.

