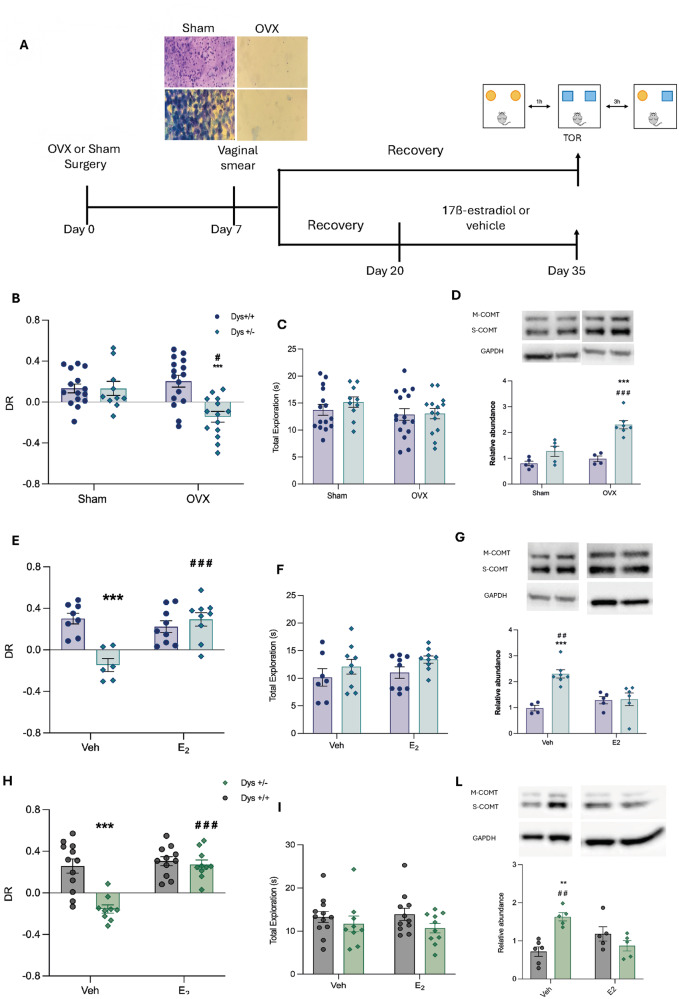
Fig. 2. Ovariectomy produces cognitive impairments in female Dys + /− mice and 17ß-estradiol rescues Dys-dependent cognitive deficits in both Dys + /− ovariectomized female and Dys + /− male mice through the COMT contribution.
A Timeline depicting the experimental procedure. B Temporal Order Recognition test. 2-way ANOVA analysis revealed a genotype effect F (1, 51) = 9.690, **p < 0.003, and a main effect of interaction surgeryXgenotype F (1,51) = 9.674, **p = 0.0031 but not a main surgery effect F (1, 51) = 3.425, p = 0.07. Bonferroni’s Multiple Comparison tests. *p = 0.011 Dys + /− Sham vs. Dys + /− OVX; ***p = 0.0001 Dys + /+ OVX vs Dys + /− OVX. C Total exploration in seconds. 2-way ANOVA, Genotype F (1,51) = 0.5846 p = 0.4480; Surgery F (1,51) = 2.06, p = 0.1573; SurgeryXGenotype F (1,51) = 0.3675, p = 0.547. Dys + /+ n = 31 (Sham n = 15, OVX n = 16), Dys + /− n = 25 (Sham n = 11, OVX n = 14). D COMT protein level alteration in the mPFC of Sham and OVX mice. 2-Way ANOVA revealed a main genotype effect F(1, 17) = 32.19 ***p < 0.0001, surgery effect F(1,17) = 14.67 **p = 0.0013 and a GenotypeXSurgery effect F(1, 17) = 7.225 *p = 0.0156. Bonferroni’s multiple comparison test ***p < 0.0001 vs Dys + /+ OVX, ###p = 0.0007 vs Dys + /− Sham (Dys + /+: OVX n = 4, Sham n = 5; Dys + /− OVX n = 7, Sham n = 5). E Temporal order recognition test in Veh or E2-treated OVX mice. 2Way-ANOVA analysis showed a Treatment effect F(1,30) = 11.73 **p = 0.0018 and a Genotype effect F(1,30) = 12.74 **p = 0.0012 as well as the interaction GenotypeXTreatment F(1,30) = 22.99 ***p < 0.0001. Bonferroni’s multiple comparisons test: ***p < 0.0001 Dys + /− Veh vs OVX, ***p < 0.0001 Dys + /+ Veh vs Dys + /− Veh. (Dys + /+ Veh n = 8, E2 n = 9; Dys + /− Veh n = 6, E2 n = 9). F Total exploration time. 2Way ANOVA showed no effects of E2 treatment in the total exploration time. 2Way-ANOVA Treatment effect F(1,30) = 0.8988 p = 0.3507, Genotype effect F(1,30) = 3.429 p = 0.0739, Interaction Genotype X Treatment F(1,30) = 0.0339 p = 0.8551. G COMT protein level alteration OVX Veh- and E2-treated female mice. 2-Way ANOVA revealed a main Genotype X Treatment Effect F(1, 18) = 11.54, **p = 0.0032 and a main genotype effect F(1, 18) = 12.82 **p = 0.0021 but not a main treatment effect F(1,18) = 3.184, p = 0.0912. Bonferroni multiple comparison test ***p = 0.0008 vs Dys + /+ Veh, ##p = 0.0044 vs Dys + /− E2 (Dys + /+: Veh n = 4, E2 n = 5; Dys + /− OVX n = 7, E2 n = 6). H Temporal order recognition test in Veh or E2-treated male mice. 2Way-ANOVA revealed a Genotype effect F(1,38) = 17.78 ***p = 0.0001 and a Treatment effect F(1,38) = 20.30 ***p < 0.0001 as well as an Interaction TreatmentXGenotype F(1,38) = 12.95 ***p = 0.0009. Bonferroni’s multiple comparisons test: ***p < 0.0001 Dys + /+ Veh vs. Dys + /− Veh, ***< 0.0001 Dys + /− Veh vs. Dys + /− E2 (Dys + /+ Veh n = 12, E2 n = 11; Dys + /− Veh n = 9, E2 n = 10). I Total exploration time in males. 2Way-ANOVA showed no effect of the treatment on the working memory performance: Treatment effect F(1,38) = 0.01954 p = 0.889, Genotype F(1,38) = 2.854 p = 0.0994, Interaction F(1,38) = 0.3202 p = 0.5748. All data are represented as mean ± S.e.m. L COMT protein level alteration in Veh and E2-treated male mice. 2-Way ANOVA revealed a main genotypeXtreatment effect F(1, 17) = 18.91, **p = 0.0004 and a main genotype effect F(1, 17) = 4.608, p = 0.0465 but not a main treatment effect F(1,17) = 1.129, p = 0.3029. Bonferroni’s multiple comparison test: **p < 0.001 vs Dys + /+ Veh, # #p = 0.0097 vs Dys + /− E2 (Dys + /+: Veh n = 6, E2 n = 5; Dys + /− Veh n = 5, E2 n = 5).

