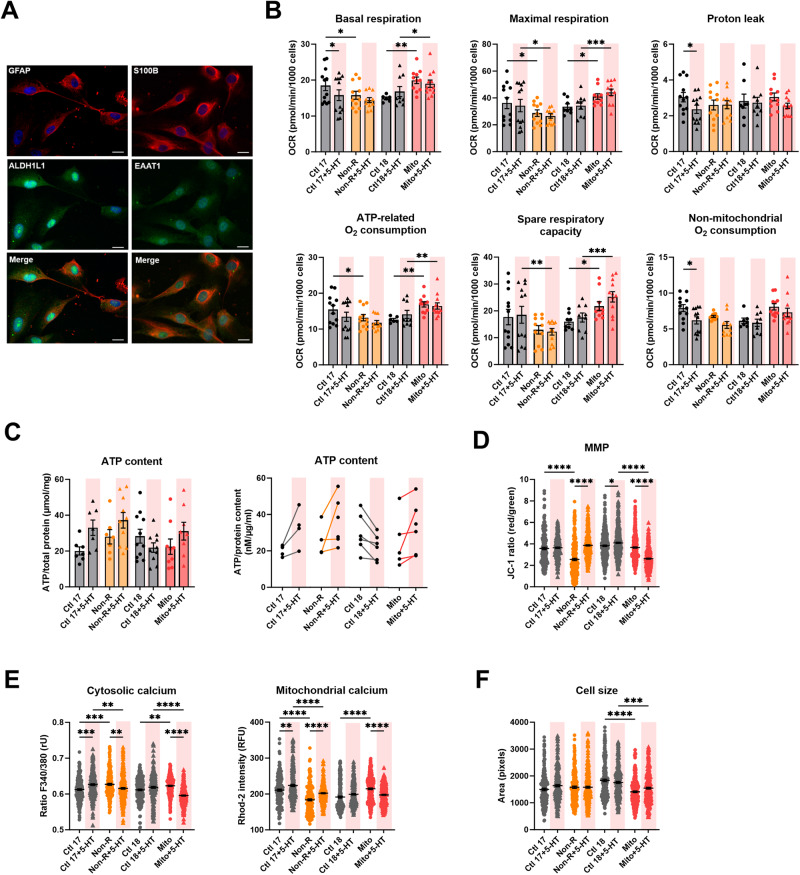
Fig. 2. Effect of serotonin on the mitochondrial bioenergetics in astrocytes.
A Astrocytes markers. Immunofluorescence stainings show that cells express the typical mature astrocytes markers GFAP, ALDH1L1, S100β, and EAAT1. Scale bar indicates 20 µm. B Mitochondrial respiration. The oxygen consumption rate (OCR) was measured in untreated and serotonin-treated astrocytes following the Agilent XF Mito Stress Test protocol consisting of sequential injections of oligomycin (Oligo), carbonyl cyanide-4-(trifluoromethoxy)-phenylhydrazone (FCCP) and rotenone/antimycin A (Rot/AntA) to reveal different respiratory parameters. OCR values were normalized to 1000 cells by counting DAPI-stained nuclei. Experiments were conducted pairwise allowing direct comparison. Bar plots show normalized mean OCR values ± SEM. C ATP content was measured in untreated and serotonin-treated astrocytes using a luminescent assay and normalized to protein amount. Left: bar plot shows nM ATP per µg/mL proteins ± SEM. Right: before-after graph shows nM ATP per µg/mL proteins in individual paired replicates, i.e. astrocytes from the same passage, harvested and measured at the same time. D Mitochondrial membrane potential (MMP) was measured with the JC-1 dye and is indicated by the fluorescence ratio between JC-1 aggregates (fluorescing in red) over JC-1 monomers (fluorescing in green). Dot plot shows mean red/green ratios ±SEM. E Cytosolic calcium was measured as the Fura-2 fluorescence ratio F340/380 and is represented as mean ratio ±SEM (left). Mitochondrial calcium levels were measured using Rhod-2/AM and are presented as mean fluorescence intensity, in relative fluorescent unit ±SEM (right). F Cell size was analyzed by assessing area (pixels) of Fura-2/AM-loaded cells. Dot plot shows the number of pixels ±SEM. Ctl17 and Ctl18: healthy controls; Non-R: non-responder patient; Mito: mitochondriopathy patient; 5-HT: serotonin. Respiration data were analyzed a mixed-effect analysis one-way ANOVA. ATP content, MMP and calcium imaging data were analyzed with a one-way ANOVA without matching or pairing. Significant differences were indicated with *p < 0.05, **p < 0.005, ***p < 0.0005) and ****p < 0.0001.

