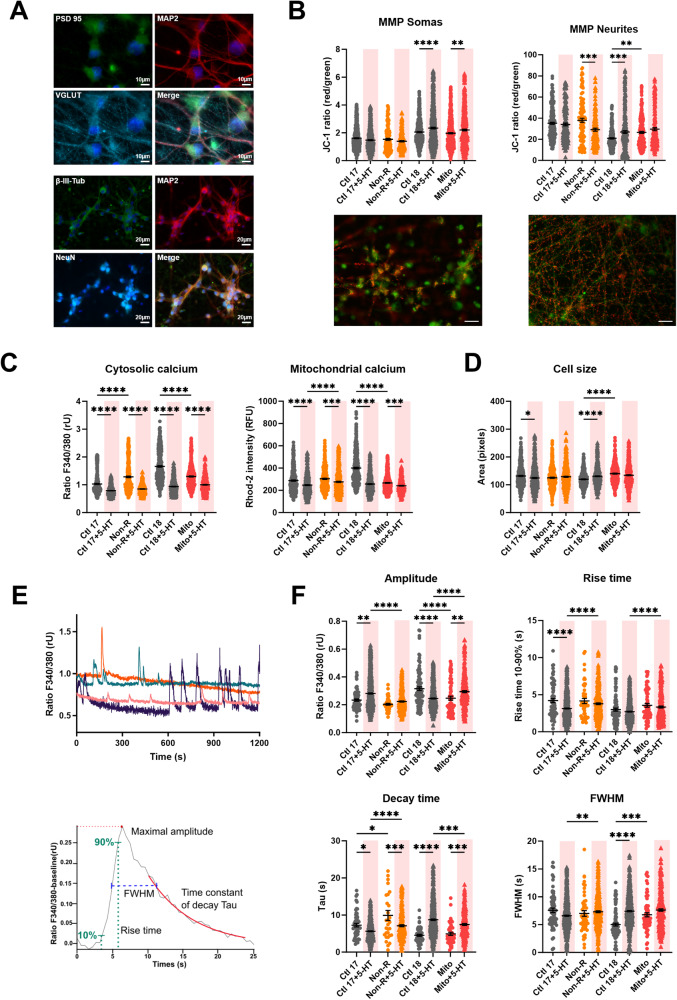
Fig. 3. Effect of serotonin on mitochondrial membrane potential (MMP), calcium homeostasis and dynamics in iPS-Neurons.
A Neuronal markers. Immunofluorescence stainings on untreated control neurons revealed that the induced neurons express typical neuronal cytoskeleton proteins MAP2 and βIII-Tubulin and neuronal nuclear marker NeuN. PSD95 and VGLUT1 expression indicated the presence of mature synaptic terminals. VGLUT1 expression suggested that most of the induced neurons are cortical-like glutamatergic neurons. Scale bars indicate 20 µm or 10 µm. B MMP was measured with the JC-1 dye and is indicated by the fluorescence ratio between JC-1 aggregates (fluorescing in red) over JC-1 monomers (fluorescing in green). Mitochondria from somas and neurites appeared on different focal planes and were therefore imaged separately. Representative images show red and green JC-1 fluorescence in the relevant structure. Scale bar indicates 20 µm. Dot plot shows mean red/green ratios ±SEM. C Calcium homeostasis in untreated and serotonin-treated neurons. Cytosolic calcium was measured as the Fura-2 fluorescence ratio F340/380 and is represented as mean ratio ±SEM. Mitochondrial calcium levels were measured using Rhod-2/AM and are presented as mean fluorescence intensity, in relative fluorescent unit ±SEM. D Cell size was analyzed by assessing area (pixels) of Fura-2/AM-loaded cells. Dot plot shows the number of pixels ±SEM. E Spontaneous calcium transients were analyzed in Fura-2/AM-loaded neurons. Example traces show representative calcium transients in a neuron (above) and a baseline subtracted calcium peak, illustrating maximal amplitude, rise time between 10 and 90% of maximal amplitude, the exponential fit used to calculate the time constant of decay Tau, and the full-width at half maximum (FWHM) (below). F Calcium transient dynamics in untreated and serotonin-treated neurons. Graphs show the maximum amplitude of the calcium transients (ratio 340 nm/380 nm ±SEM), the rise time, the time constant of decay Tau (s ± SEM) and the FWHM (s ± SEM). Ctl17 and Ctl18: healthy controls; Non-R: non-responder patient; Mito: mitochondriopathy patient; 5-HT: serotonin. All data were analyzed with a one-way ANOVA without matching or pairing. Significant differences were indicated with *p < 0.05, **p < 0.005, ***p < 0.0005 and ****p < 0.0001.

