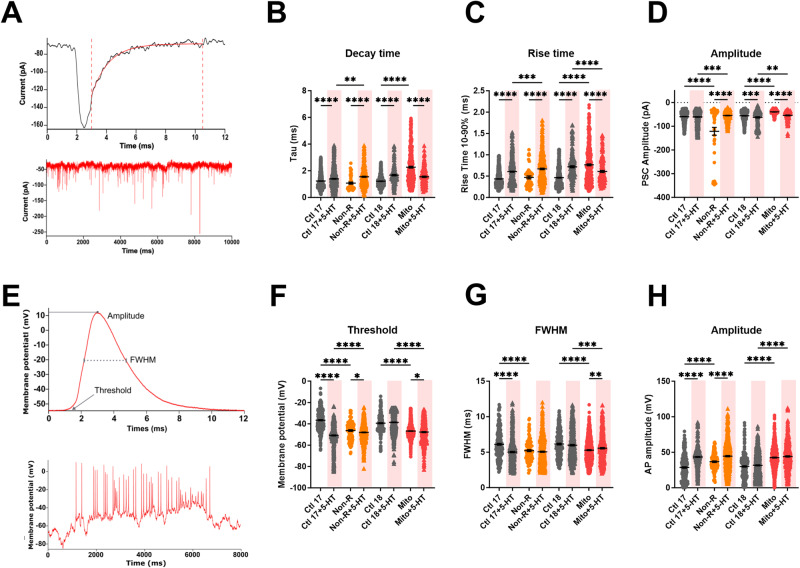
Fig. 5. Effect of serotonin on postsynaptic currents and action potentials kinetics.
A Spontaneous post-synaptic currents (PSCs) were recorded at a holding potential of −80 mV. Example traces show one single PSC (above) spontaneous PSCs (below). Graphs show B the time constant of decay Tau (ms ± SEM), C the rise time between 10% and 90% of the maximal amplitude, and D the maximum amplitude of the PSCs (pA ± SEM) in untreated and serotonin-treated neurons. E Spontaneous APs at −80 mV were analyzed individually. Example traces show a single AP trace illustrating threshold, amplitude and full width at half maximum (FWHM) (above) and spontaneous APs (below). Graphs show F mean threshold in mV ± SEM, G mean FWHM in ms ± SEM and H mean AP amplitude in mV ± SEM in untreated and serotonin-treated neurons. Ctl17 and Ctl18: healthy controls; Non-R: non-responder patient; Mito: mitochondriopathy patient; 5-HT: serotonin. All data were analyzed with a one-way ANOVA without matching or pairing. Significant differences were indicated with *p < 0.05, **p < 0.005, ***p < 0.0005 and ****p < 0.0001.

