Fig. 2.
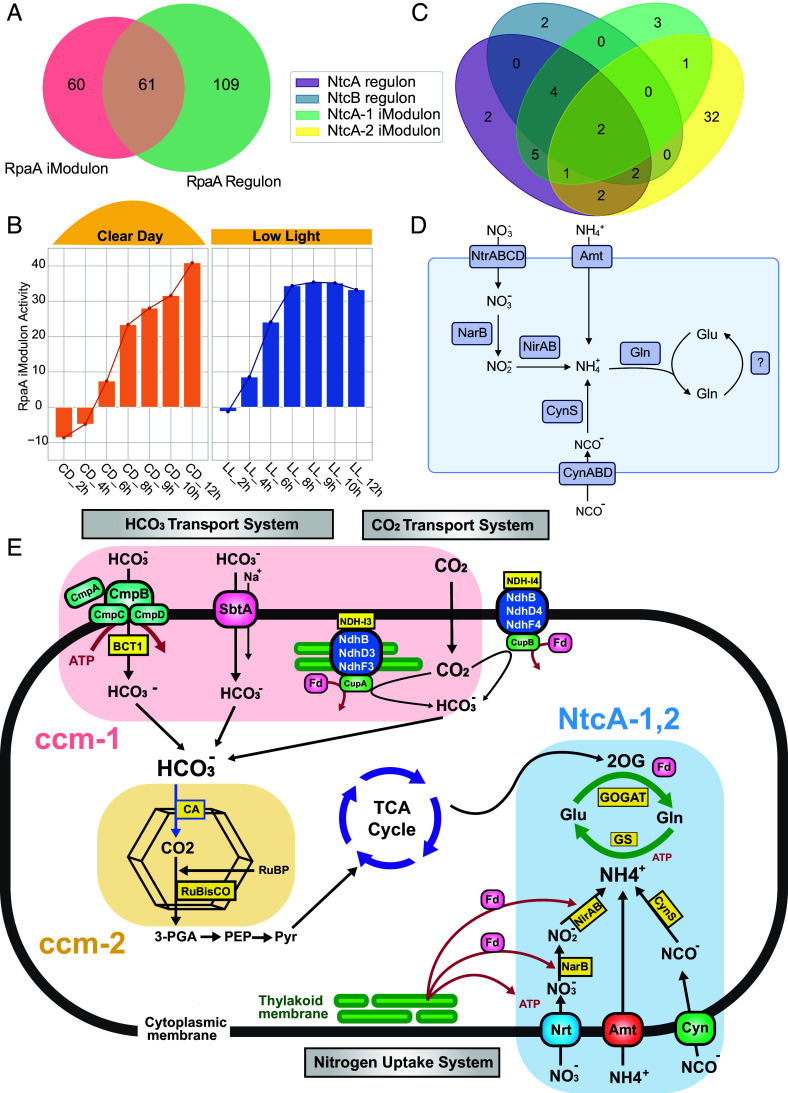
iModulons show high consistency with known regulons. (A) Venn diagram between the RpaA regulon and RpaA iModulon. (B) Activity of the RpaA iModulon for samples during Clear Day and constant Low Light conditions. The Clear Day condition is defined by a maximal light intensity of 600 μmol photons m−2 s−1, peaking at 6 h after dawn. The Low Light condition has a constant light intensity of 50 μmol photons m−2 s−1. (C) Venn diagram between the NtcA, NtcB regulons, and the two NtcA iModulons. (D) Diagram of the nitrogen metabolic pathways with genes from the NtcA-1 and NtcA-2 iModulons mapped on. (E) Integrated map depicting the interplay between carbon and nitrogen metabolisms with the carbon and nitrogen associated iModulons.

