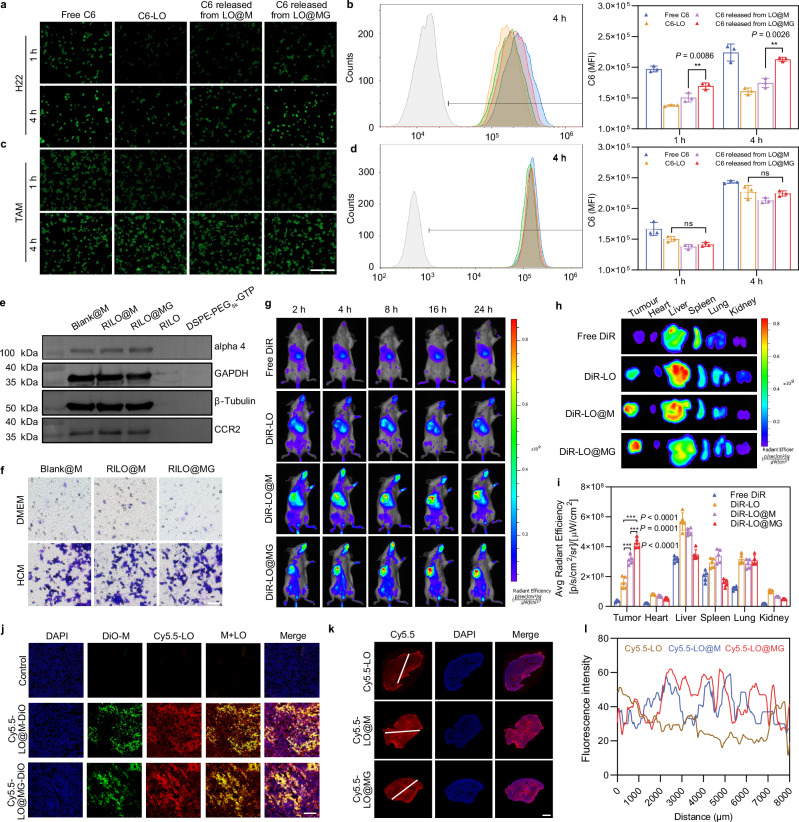
Fig. 4. The tumour accumulation and deep penetration capabilities of RILO@MG.
a, b Fluorescence microscopy images (a) and flow cytometric analysis (b) of the uptake by H22 cells at the same concentration (200 ng/mL) of C6 (n = 3 biologically independent experiments). c, d Fluorescence microscopy images (c) and flow cytometric analysis (d) of the uptake by TAMRAW at the same concentration (200 ng/mL) of C6 (n = 3 biologically independent experiments). The drug was replaced by C6 (green) in (a–d). Scale bar = 200 μm in (a–d). e Detection of chemotaxis-associated proteins (alpha 4 and CCR2) by western blotting (n = 3 biologically independent experiments). f Tumour-migrating capability was evaluated by Transwell assay in vitro (n = 3 biologically independent experiments). Representative microscopy images of migrating Blank@M, RILO@M and RILO@MG after incubation for 16 h. Scale bar = 200 μm. g–i In vivo images (g) of biodistribution in the H22 tumour-bearing mouse model after treatment with different formulations (i.v.). Ex vivo images (h) and average radiant efficiency (i) of tumours and main organs at 24 h (n = 5 biologically independent animals per group). DiR was a near-infra-red tracer in (g–i). j Representative confocal images of the H22 tumour tissue sections after i.v. administration at 24 h, which indicated that injected M1-type macrophages could release drugs at the tumour site (n = 3 biologically independent experiments). DiO and Cy5.5 were selected to label injected M1-type macrophages (green) and replace the drug (red), respectively. Scale bar: 100 μm. k, l Penetration overviews (k) of the whole H22 tumour tissue sections after i.v. administration at 24 h (n = 3 biologically independent experiments). The fluorescence intensity of the white line marked region was quantified with ImageJ (l). Cy5.5 was selected to replace the drug (red). Scale bar, 2 mm. Data are expressed as the mean ± SD and were processed by one-way ANOVA with Tukey’s multiple comparisons test (b, d, i). **P < 0.01; ***P < 0.001; ns, no significance. BMDMs were used in all experiments involving macrophages unless marked RAW superscript.

