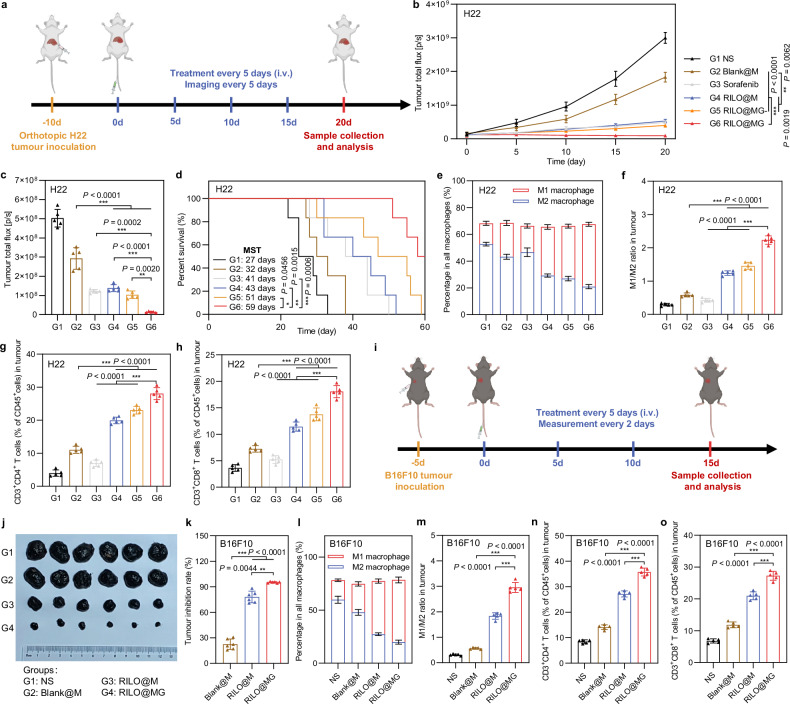
Fig. 8. Efficacy validation of RILO@MG in the orthotopic H22 tumour model and B16F10 tumour-bearing mouse model.
a Schematic of the orthotopic H22 tumour model experiment (dose of 3.0 × 10⁶ cells per mouse per injection, equal to 4 mg/kg R848 and 3.4 mg/kg INCB; sorafenib: 10 mg/kg). b–d In vivo bioluminescence intensity curves (b), ex vivo livers on Day 20 of bioluminescence quantification (c) and animal survival (d) of the orthotopic H22 tumour model receiving the indicated treatments (n = 5 biologically independent animals for b and c and n = 6 biologically independent animals for survival). e-h, Flow cytometry quantitative data of M1-type macrophage and M2-type macrophage (e, f) and CD4+ and CD8+ T cells (g, h) in tumours of the orthotopic H22 tumour model sacrificed on Day 20 (n = 5 biologically independent animals). i Schematic of the B16F10 tumour-bearing mouse model experiment (dose of 3.0 × 10⁶ cells per mouse per injection, equal to 4 mg/kg R848 and 3.4 mg/kg INCB). j, k Tumour photographs (j) and tumour inhibition rate (k) of the sacrificed B16F10 tumour-bearing mice at the study endpoint (n = 6 biologically independent animals). l–o Flow cytometry quantitative data of M1-type macrophage and M2-type macrophage (l, m) and CD4+ and CD8+ T cells (n, o) in tumours of the sacrificed B16F10 tumour-bearing mice (n = 5 biologically independent animals). Data are expressed as the mean ± SD. One-way ANOVA with Tukey’s multiple comparisons test (c, f–h, m–o), the Welch ANOVA with Dunnett’s T3 multiple comparisons test (k), two-way ANOVA with repeated measures (b) and log-rank tests for survival data (d) were used for statistical analysis. **P < 0.01; ***P < 0.001. BMDMs were used in all experiments involving macrophages.

