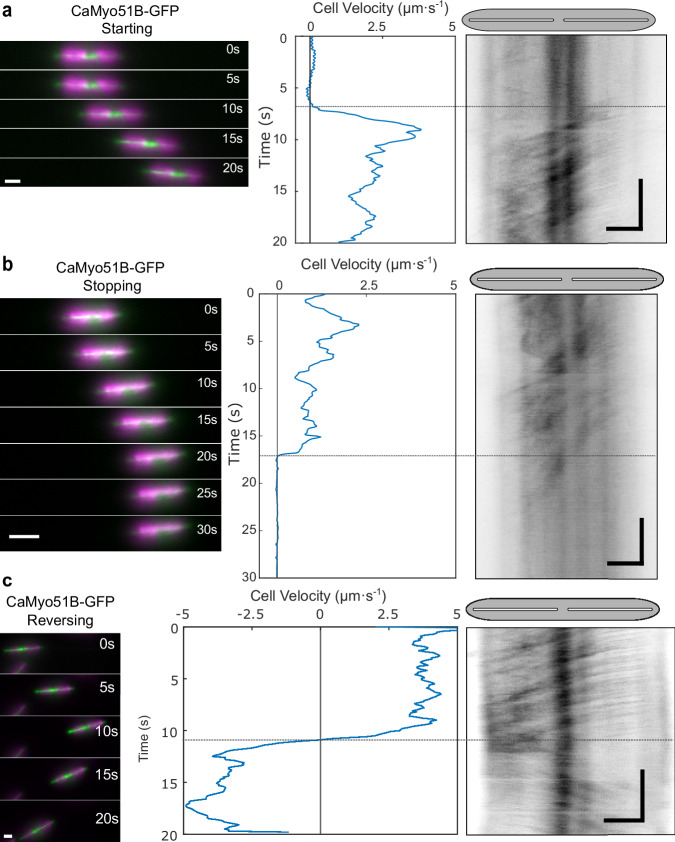
Fig. 5. Dynamic localization of CaMyo51B in cells during changes in their motility state.
Analysis of 20–30 s time-lapse segments of CaMyo51B-GFP expressing cells during a starting, b stopping, and c reversing. (Left panels) Montages showing the position of cells at 5 s intervals (GFP in green, chloroplast autofluorescence in magenta, scale bars: 5 µm). (Middle panels) Cell velocity as a function of time, generated from chloroplast tracking data. (Right panels) Registered kymographs generated from GFP-channel data (black) showing movement of myosins relative to the cell. The small offsets between starting/stopping/reversing of cell and myosin activity (dotted horizontal lines between middle and right panels) likely indicate mechanical compliance in the motility machinery. Gray ellipses and white slits above kymographs approximate the positions of the cell body and raphe openings, respectively. (Scale bars: horizontal = 5 µm, vertical = 5 s).

