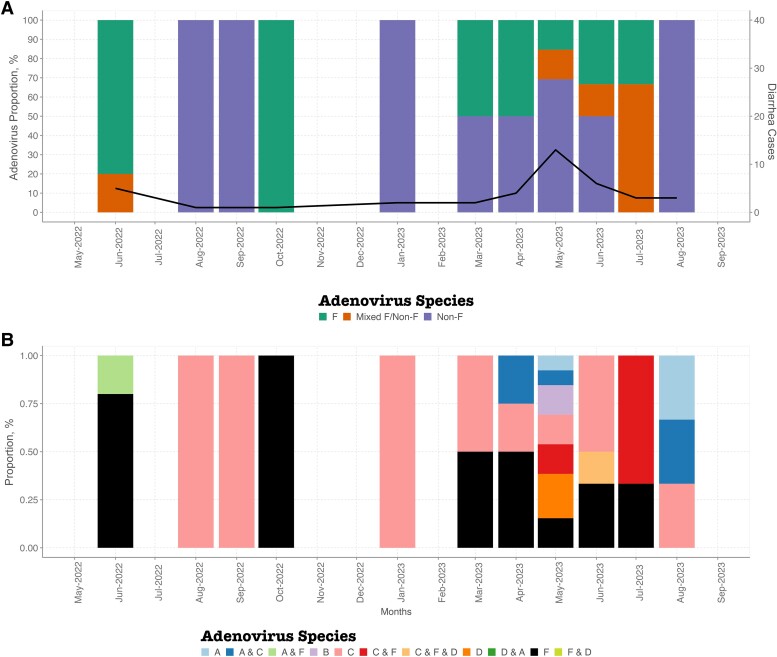
Figure 1.
Temporal distribution of human adenoviruses in coastal Kenya between June 2022 and August 2023. A, Temporal plot showing distribution of F, mixed F (F and non-F coinfections), and non-F. The primary y-axis shows the proportions of adenovirus species, while the secondary y-axis shows the total number of diarrhea monthly cases. B, Temporal plot showing the distribution of HAdV species between June 2022 and August 2023. Abbreviation: HAdV, human adenovirus.

