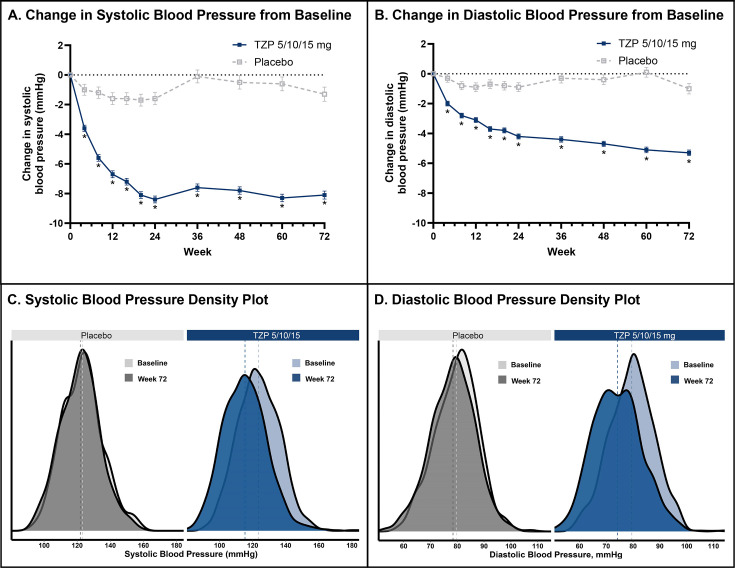
Figure 2.
Changes in blood pressure over 72 weeks: tirzepatide 5/10/15 mg compared with placebo. *p<0.001 tirzepatide vs placebo. Least-squares means are presented. Data were derived from a mixed model for repeated measures. (A) The change in systolic blood pressure from baseline to week 72. (B) The change in diastolic blood pressure from baseline to week 72. (C) The systolic blood pressure density plot at baseline and week 72 for placebo and tirzepatide treatment. (D) The diastolic blood pressure density plot at baseline and week 72 for placebo and tirzepatide treatment. TZP, tirzepatide 5/10/15 mg.

