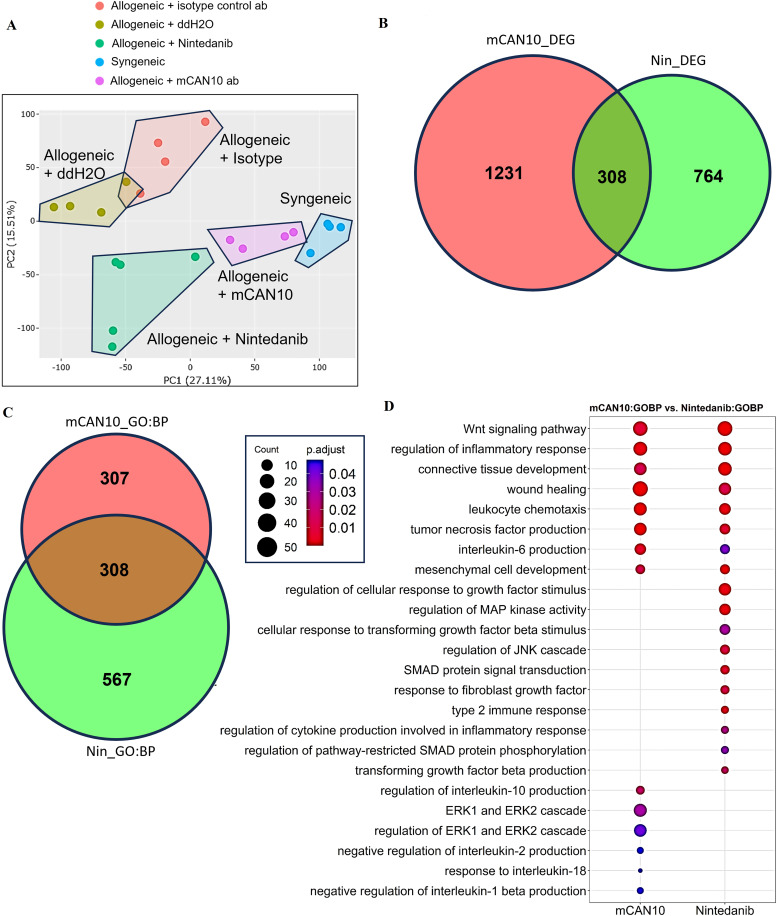
Figure 6.
Comparison of differentially expressed genes (DEGs) in allogeneically transplanted mice treated with mCAN10 or nintedanib. (A) Principal component analysis depicting the distribution of various sample groups. (B) Intersection of DEGs between nintedanib-treated mice (Nin_DEGs) and mCAN10-treated mice (mCAN10_DEGs), using a p-adjusted value cut-off of ≤0.05 and a |log2 fold change| cut-off of ≥1. (C) The number of overlapping biological process-related terms between mCAN10 and nintedanib treatment. (D) Comparison plot illustrating the signature signalling pathways between nintedanib and mCAN10 treatments. ERK, extracellular signal-regulated kinase; JNK, c-Jun N-terminal kinase; MAP, mitogen-activated protein.

