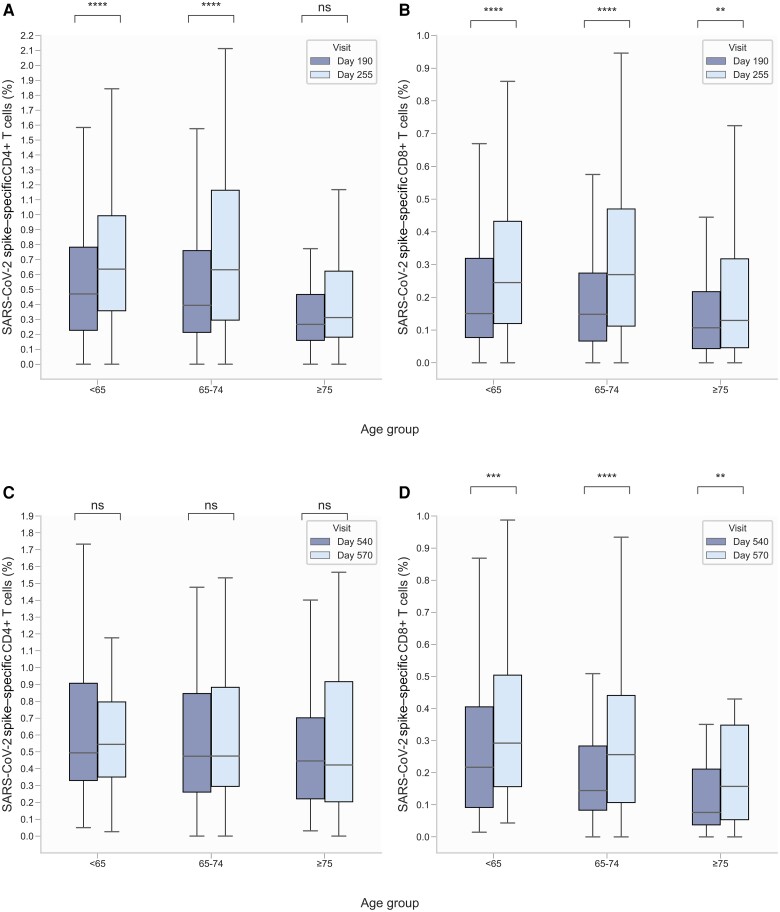
Figure 3.
Proportion of severe acute respiratory syndrome coronavirus 2 (SARS-CoV-2) spike (S)–specific CD4+ and CD8+ T cells before and after third and fourth vaccine dose, stratified by age group. S-specific CD4+ (age <65 y: n = 196, 65–74 y: n = 105, ≥75 y: n = 90) (A) and CD8+ (<65 y: n = 195, 65–74 y: n = 104, ≥75 y: n = 86) (B) T cells before and after a third dose (days 190 and 255, respectively). S-specific CD4+ (<65 y: n = 76, 65–74 y: n = 61, ≥75 y: n = 47) (C) and CD8+ (<65 y: n = 76, 65–74 y: n = 60, ≥75 y: n = 45) (D) T cells before and after a fourth dose (days 540 and 570, respectively). Boxplots show median, and whiskers extend to show 1.5 × interquartile range. Data are compared using the Wilcoxon signed-rank test. Not significant (ns): 5.00 × 10⁻² < P; **1.00 × 10⁻³ < P ≤ 1.00 × 10⁻²; ***1.00 × 10⁻⁴ < P ≤ 1.00 × 10⁻³; ****P ≤ 1.00 × 10⁻⁴. The y-axis scale differs between panels.

