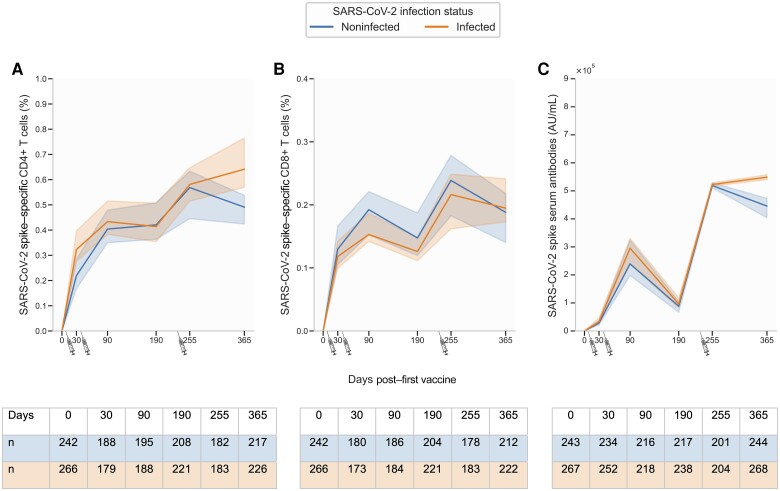
Figure 4.
Trajectory of severe acute respiratory syndrome coronavirus 2 (SARS-CoV-2) spike (S)–specific T cells and anti-S serum antibodies from baseline to day 365, stratified by infection. A, CD4+ T cells. B, CD8+ T cells. C, S serum antibodies. SARS-CoV-2 vaccination is shown by syringes. Where no baseline visit was available, the percentage of S-specific T cells was set to zero. SARS-CoV-2 vaccination is shown by syringes from BioRender.com. Data are unpaired; the solid line represents the median value and bands the 95% CI. The y-axis scale differs between panels.

