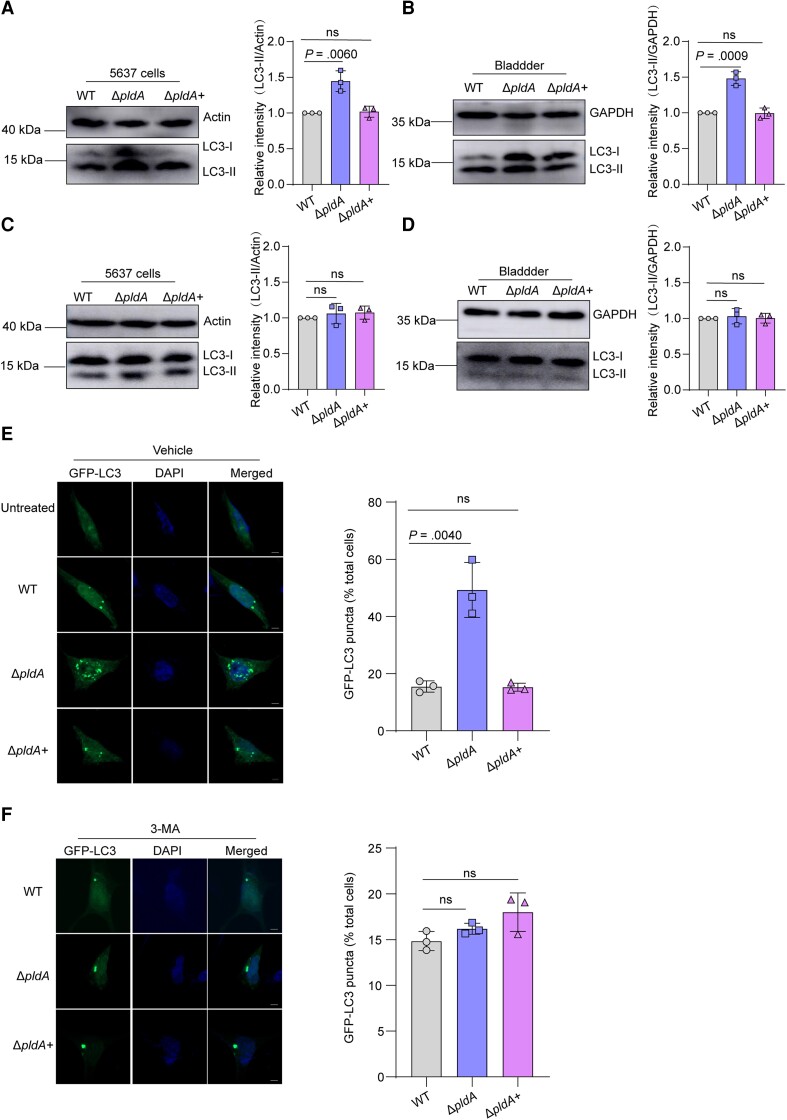
Figure 2.
PldA contributes to UPEC escape from autolysosomes by affecting autophagy. A, Western blotting of LC3-II levels in WT, ΔpldA, or ΔpldA+ infected 5637 cells at 4 hpi. Actin was used as a loading control. B, Western blotting of LC3-II levels in WT, ΔpldA, or ΔpldA+ infected mouse bladders at 6 hpi. GAPDH was used as a loading control. C, Western blotting of LC3-II in WT, ΔpldA, or ΔpldA+ infected 5637 cells treated with 3-MA. The LC3-II signal densities were normalized to that of actin. D, Western blotting of LC3-II in WT, ΔpldA, or ΔpldA+ infected mouse bladders treated with 3-MA. The LC3-II signal densities were normalized to that of GAPDH. E, 5637 cells were transfected with GFP-LC3 for 24 hours and infected with the indicated CFT073 strains or left uninfected. The cells were analyzed for GFP-LC3 puncta. Representative confocal images are shown. The bar graph shows the quantification of LC3 puncta per cell. Scale bar, 5 μm. n = 3 slides. F, 5637 cells were transfected with GFP-LC3 for 24 hours, followed by treatment with 3-MA and infection with the indicated CFT073 strains. The cells treated with 3-MA were analyzed for GFP-LC3 puncta. Representative confocal images are shown. The bar graph shows the quantification of LC3 puncta per cell. Scale bar, 5 μm. n = 3 slides. Data are representative of 3 independent experiments and presented as the mean ± SD. The bar graph shows the relative LC3-II/actin (A and C) and LC3-II/GAPDH (B and D) densities. Data are presented as the mean ± SD. P values were determined using Student t test. Significance is indicated by the P value. Abbreviations: 3-MA, 3-methyladenine; DAPI, 4′,6-diamidino-2-phenylindole; GAPDH, glyceraldehyde-3-phosphate dehydrogenase; GFP, green fluorescent protein; hpi, hours postinfection; ns, not significant; UPEC, uropathogenic Escherichia coli; WT, wild type.

