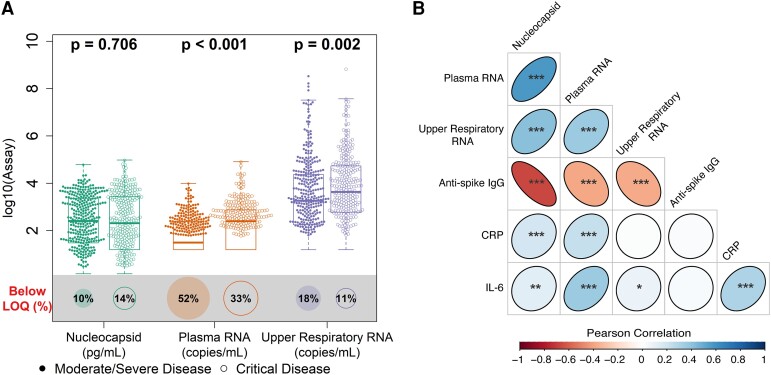
Figure 1.
Distribution of baseline viral loads by disease severity and correlation with other biomarkers. A, Distribution of baseline viral loads by assay categorized by disease severity. Box plots indicate the median (line) and IQR (box). Wilcoxon P values assess differences in medians between disease severity groups, and proportions of samples are shown below each assay's limit of quantification (LOQ; illustrated by size of bottom circle). RNA values below the assay LOQ of 1.79 log10 copies/mL were set as half the LOQ (1.49 log10 copies/mL) when measurements were above the lower limit of detection and one-quarter the LOQ (1.19 log10 copies/mL) when RNA was not detected; nucleocapsid antigen values below the assay LOQ of 3 pg/mL were set as half the LOQ (1.5 pg/mL). B, Matrix heat map of Pearson correlations between baseline biomarker levels among all patients in the primary cohort. *P < .05. **P < .01. ***P < .001. Coefficient estimates are provided in Supplementary Table 4. CRP, C-reactive protein; IL-6, interleukin 6.

