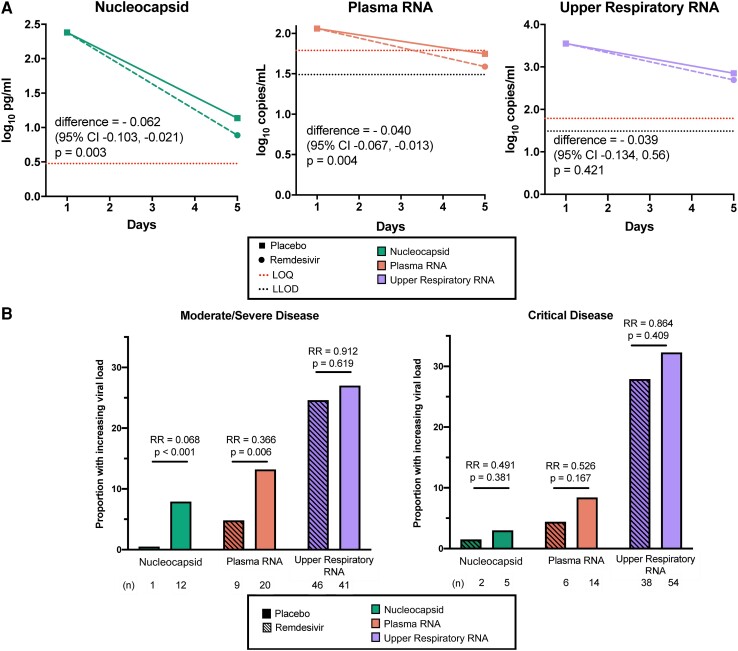
Figure 4.
Virologic efficacy of remdesivir vs placebo. A, Differences in mean daily rate of change of viral load among patients with moderate/severe disease by treatment arm. P values are shown for differences in adjusted daily rate of change when normalized to baseline level. For calculations, RNA values below the assay limit of quantification (LOQ) of 1.79 log10 copies/mL were set as half the LOQ (1.49 log10 copies/mL) when measurements were above the lower limit of detection (LLOD) and one-quarter the LOQ (1.19 log10 copies/mL) when RNA was not detected. B, Bar plot of patients with increasing or persistently elevated viral loads measured through 5 days of treatment. Relative risk (RR) of an increasing viral load comparing remdesivir and placebo recipients are shown with corresponding P values.

