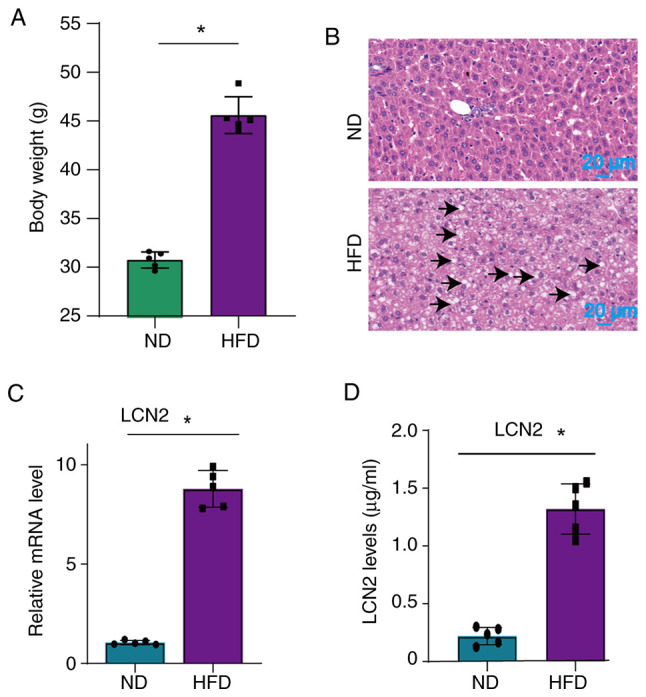
Figure 1.

Expression of LCN2 in the liver and serum of HFD-fed mice. (A) Body weight was measured in mice that were fed a ND or HFD. (B) Liver tissue was analyzed using hematoxylin and eosin staining to observe pathological changes caused by a HFD. Lipid droplets were indicated by black arrows. (C) Reverse transcription-quantitative PCR was performed to assess the expression levels of LCN2 in the livers of mice who were or were not fed a HFD. (D) Levels of LCN2 in the serum of mice who were or were not fed a HFD were measured by ELISA. Data are presented as the mean ± SEM (n=5 mice/group). *P<0.05. HFD, high-fat diet; LCN2, lipocalin 2; ND, normal diet.
