Figure 3.
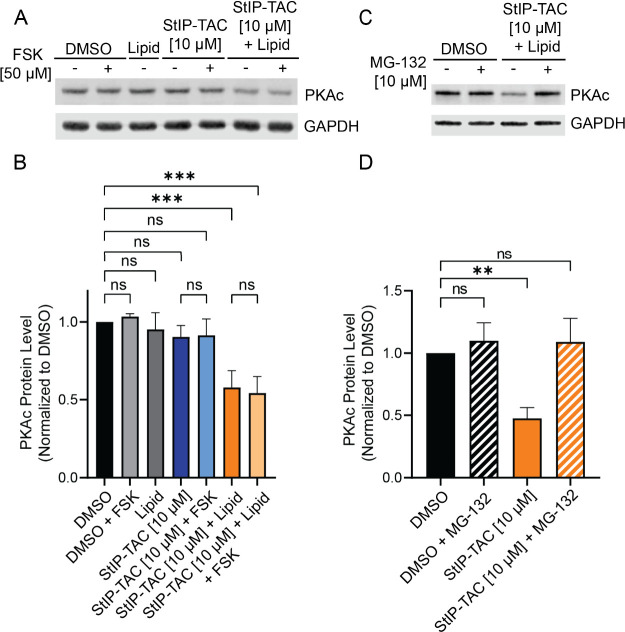
StIP-TAC treatment induces PKA degradation. (A) Representative Western blot of cells treated with vehicle control, StIP-TAC, and StIP-TAC + SAINT Protein reagent (Lipid) for 5 h (n = 3) with or without a 30 min forskolin (FSK) stimulation. Cells treated with StIP-TAC in conjunction with the SAINT Protein lipid delivery formulation demonstrate reduced PKA protein levels. (B) Densitometric quantification of three independent Western blots (n = 3) demonstrates a statistically significant reduction in PKA protein levels for cells treated with StIP-TAC and SAINT Protein reagent. No significant difference in PKA levels was detected between forskolin-stimulated and unstimulated treatments. Quantification was performed via Li-COR Image Studio. PKA bands for each treatment were normalized to the GAPDH loading control and compared to the DMSO control treatment. ***p < 0.001; ns, not significant as assessed by one-way ANOVA and Bonferroni’s multiple comparisons test. Error bars represent standard deviation. (C) Representative Western blot of cells treated with 10 μM proteasomal inhibitor MG-132 with vehicle control or StIP-TAC with SAINT protein reagent for 5 h (n = 3). Cells treated with StIP-TAC and SAINT protein demonstrate a reduction in PKA protein levels that are rescued with the addition of proteasomal inhibitor. (D) Densitometric quantification of three independent Western blots (n = 3) demonstrating a statistically significant reduction in PKA protein levels in cells treated with StIP-TAC and SAINT Protein reagent that is rescued to near-baseline levels upon proteasomal inhibition. Quantification was performed in Li-COR Image Studio. PKA bands for each treatment were normalized to the GAPDH loading control and compared to the DMSO control treatment. **p = 0.003; ns, not significant as assessed by one-way ANOVA and Bonferroni’s multiple comparisons test.

