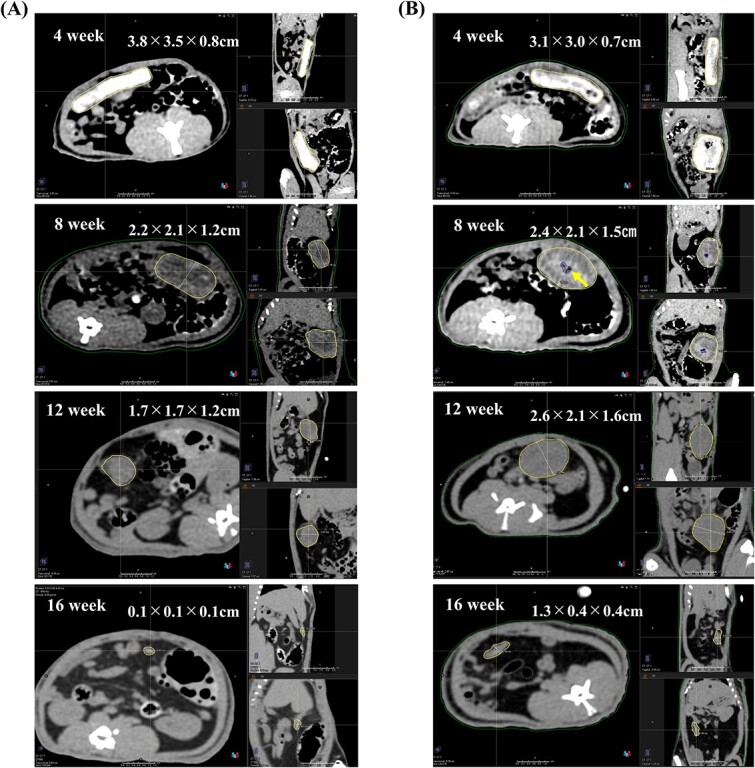
Fig. 3.

Comparison of the two groups by CT. (A) CT of the control group, taken at four-week intervals, showed the PGA spacer within the rat’s abdominal cavity. Over time, the spacer decreases in size, with noticeable morphological changes between weeks 4 and 8, including an increase in thickness and a more spherical shape. (B) CT of the CPA-dosed group, taken at four-week intervals, demonstrates a similar pattern of size reduction in the spacer. Notably, a 0.05-cm3 pocket of air (arrow) is observed within the spacer at week 8. CT, computed tomography; PGA, polyglycolic acid; CPA, cyclophosphamide.
