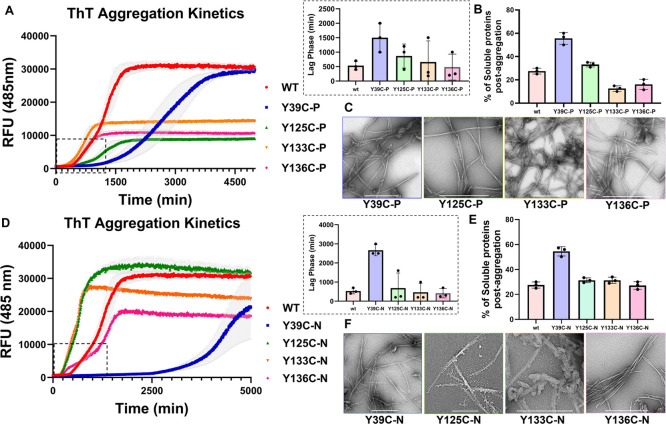
Figure 6.
(A) Aggregation kinetics of phosphorylated α-Syn based on thioflavin T fluorescence (ThT ± SEM; n = 3). The difference in the lag phase is shown in the bottom box. (B) Corresponding quantification of the remaining soluble protein ± SEM of WT α-Syn, α-SynY39C-P, α-SynY125C-P, α-SynY133C-P, and α-SynY136C-P. (C) Electron micrographs of phosphorylated proteins (the scale bars are 500 nm). (D) Aggregation kinetics of nitrated α-Syn based on thioflavin T fluorescence (ThT ± SEM, n = 3). (E) Corresponding quantification of the remaining soluble protein ± SEM of WT α-Syn, α-SynY39C-N, α-SynY125C-N, α-SynY133C-N, and α-SynY136C-N. (F) Electron micrographs of nitrated proteins (the scale bars are 500 nm). For expanded EM micrographs, please see the Supporting Information, Section 17.

