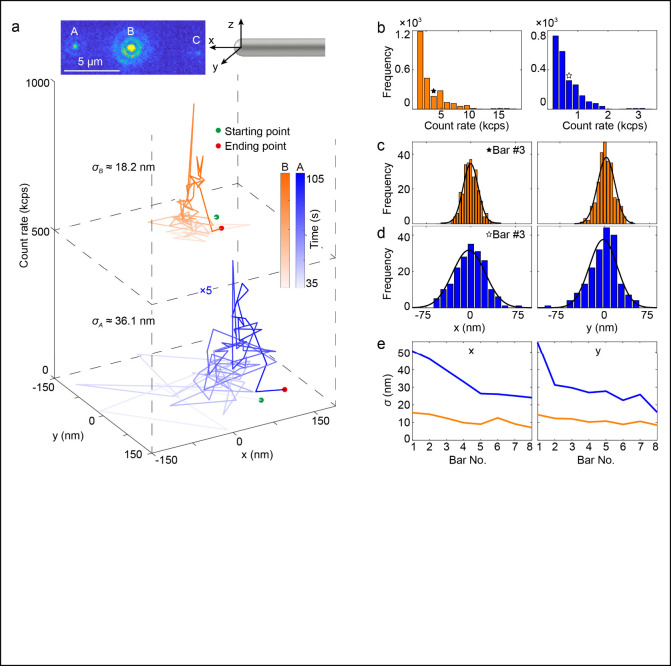
Figure 3.
Detailed trapping dynamics and localization analysis: (a) Trajectory mapping for the central positions of spots A (blue) and B (orange), deduced from two-dimensional Gaussian fitting applied to the PL intensity profiles. (b) Intensity-based histograms for points A and B. (c, d) Exemplary spatial distributions for particle locations at points B and A, respectively, corresponding to the PL intensity range of 4000–5000 counts per second (cps), as indicated above the third histogram bar. (e) Full width at half-maximum (fwhm) analysis for the spatial distribution of points A (blue) and B (orange) across varying intensity ranges, for x- and y-directions, respectively.

