
Figure 1.
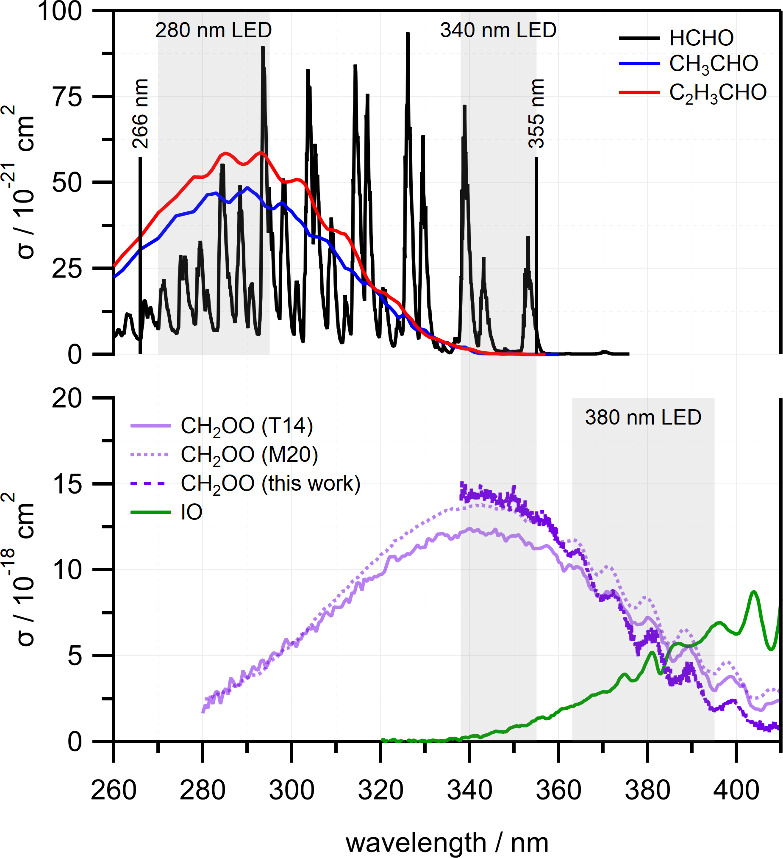
Absorption spectra of (top panel) RCHO reactants (HCHO, CH3CHO, and C2H5CHO) and (lower panel) transient species CH2OO and IO, obtained from various sources, as discussed in the text. The gray shaded boxes represent the wavelength regions covered by each probe UV LED. Probe wavelength ranges are restricted to λ ≥ 315 nm for 266 nm photolysis and λ ≥ 363 nm for 355 nm photolysis.