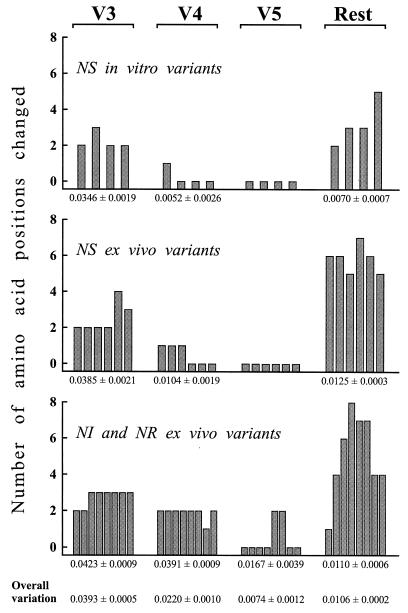
FIG. 3.
Distribution of predicted amino acid changes relative to progenitor TCA FIV in the V3, V4, and V5 regions and in the rest of the SU of the viral variants listed in Fig. 2, grouped by source and neutralization phenotype. The figures under the bars represent the mean number of changes per amino acid position in the indicated SU regions ± the standard error for the groups of variants depicted above, while overall variation is the same parameter for all the variants. Variable regions V3 to V5 are delineated as shown in Fig. 2. Bars represent individual variants.

