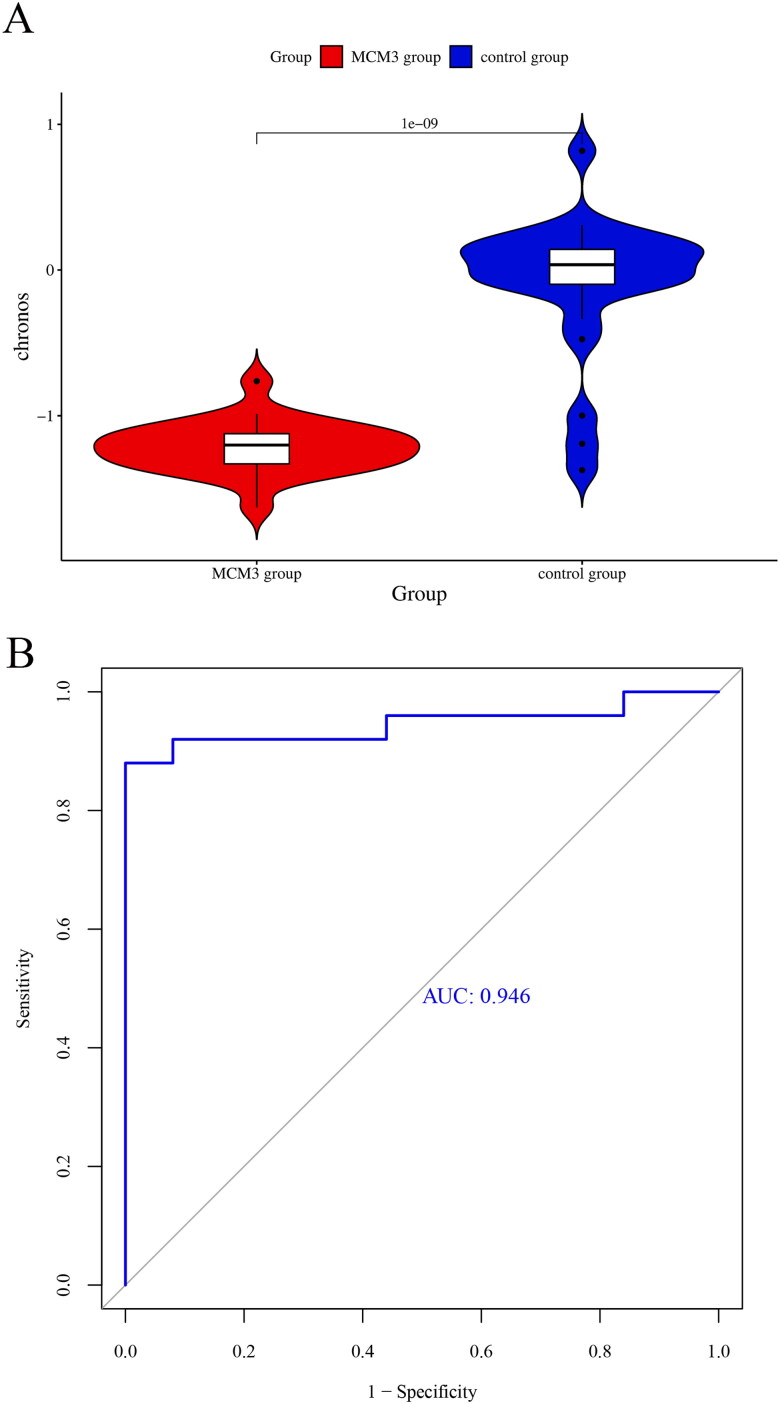
Figure 5.
Comparing the effect of knocking out MCM3 in the CRISPR system on the growth of PAAD cells.
(A) Violin diagram comparing the difference in chronos scores between the MCM3 knockout group and the control group;
(B) Identification of ROC curves between MCM3 knockout group and control group using chronos score.

