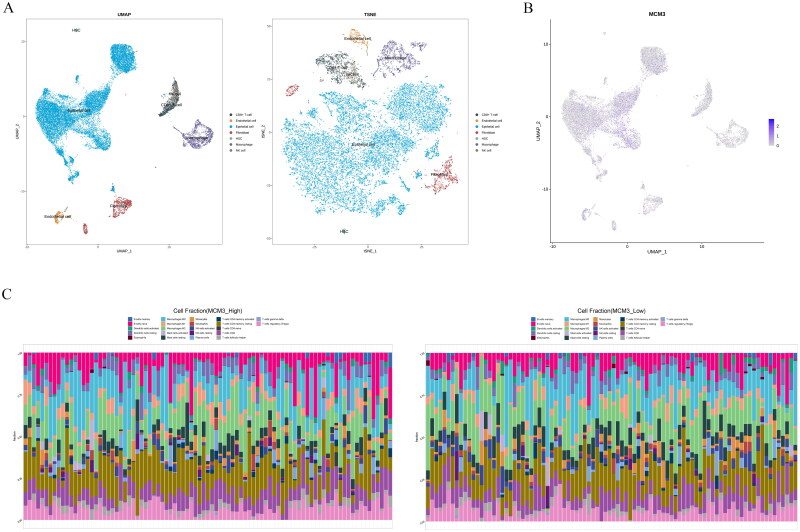
Figure 7.
PAAD Tissue immune microenvironment status.
(A) Single cell sequencing analysis of PAAD tissue based on UMAP and TSNE dimensionality reduction;
(B) Expression of MCM3 in various cells of PAAD tissue based on UMAP dimensionality reduction;
(C) Differences in immune infiltration between the high and low expression groups of MCM3.

